
Disreputable comparisons
Currently fashionable tech stocks are expensive, but one is less so than the others
In our last newsletter, we looked at the characteristics of the FATMAAN companies, Facebook, Alphabet (the company that owns Google), Amazon, Tesla, Microsoft, Apple and Netflix. How fast are they growing? How much of their revenue is consumed by meeting costs, and how much are they devoting to investment in the future?
None of that discussed the current valuations of these businesses. Company A may be generating more cash flow and growing faster than company B, but if company B is much the cheaper of the two, it may be the better investment.
Approaches to valuation
New recruits arriving at investment banks are taught that there are several ways to value businesses. One is to look at precedent transactions. Another is to analyse comparable companies. The essence of both is to try to find an easily measurable characteristic of a group of businesses that is good at predicting some measure of their value. In the case of precedent transactions, the measure of value will be the price at which those businesses were recently sold; in the case of co-cos (company comparisons), it will be the valuation implied by current stock exchange trading in the shares of the businesses.
Investors will tend to value businesses that make large profits more than ones where profits are slight. That being so, we might discover that if we plot the profits of six supermarket businesses against their current value, the points stray only a little from a straight line.

Now that we have discovered that profits and value are closely related, we could infer a value for a seventh supermarket by interpolating its profits using that same line.
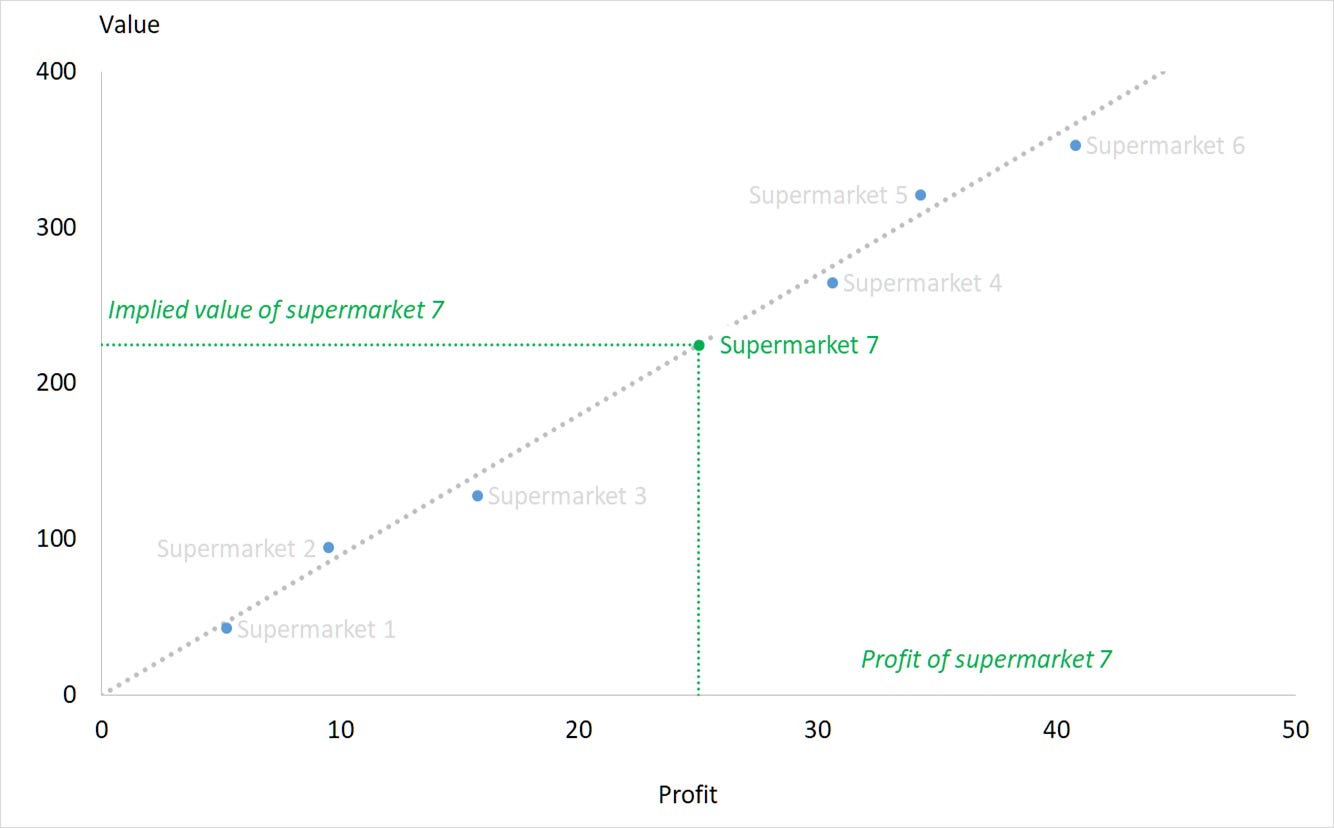
In this example, since each supermarket is arrayed along a line, and that line goes through the zero point, we can say that the ratio between their value and their profits is more or less constant; that they trade on a predictable price-earnings ratio.
Price-earnings ratios aren’t much use if there are no earnings. Other measures have to be found for companies that are too early stage to have yet made a profit, or once made them but find themselves currently on hard, loss-making times. Analysts commonly take revenue as the driver of value, in which case the plot represents not a price to earnings ratio but a price to sales ratio.
Companies even earlier in their evolution may not yet have any sales, in which case common practice is to resort to physical characteristics of the businesses. In the case of supermarkets, it could be the number of stores they operate, or the linear metres of shelf space from which they trade.
In principle, company values could be plotted against anything that could conceivably be connected to them, to see if there was a relationship. We could try the chief executive’s inside leg measurement. While we suggest this frivolously, it is not as ridiculous as it sounds, since it is well documented that when choosing a leader, for example a jury foreman, people instinctively favour the tallest candidate. In the thirty US presidential elections between 1900 and 2016, twenty of the winning candidates have been taller than their opponents, and one was the same height. It’s therefore conceivable, just about, that taller CEOs are associated with more valuable businesses.
Obstacles
While these ideas are simple enough, they are riddled with contradictions in practice.
Is one supermarket group more valuable than another because it has more shelf space and is as a consequence more profitable? Or has it been able to accumulate the shelf space because it has generated more profits over the years which it could reinvest? Is shelf space the driver of profit, the consequence of it or merely correlated with it? And does the largest business have the tallest CEO because employees are more willing to follow tall leaders, or because its profits have allowed it to out-compete the other firms for the tallest available candidate?
If the notion that companies in a sector trade on a given multiple of profits or sales is repeated often enough, it will become a self-fulfilling prophecy. Investors will seek out what they perceive to be opportunities that are trading at below the ratio in question, and shun ones that are trading above it, so that multiples will eventually converge. Investment banks will use that ratio to set the price for new companies at IPOs. But are these businesses really worth those amounts? Some people believe that if that’s what the market says they are worth, no further debate is relevant. Not everyone will agree.
And finally, and critically, though a business may be priced consistently relative to its peers according to some ratio, it is entirely possible that the whole lot of them are expensive, or cheap, in absolute terms. A tech stock that is trading on twenty year’s worth of sales may be insanely priced even if other firms are trading at thirty times, if they have been lifted to these heights by a speculative tide.
Objects of ridicule
It is the purpose of Pier Analysis to apply to the analysis of quoted companies the outlook of investors in infrastructure assets. In that field, these relative valuation techniques are the object of ridicule. No one would think to argue that the airport that they had acquired was good value because the price they paid per passenger works out cheaper than some other airport. [1] Infrastructure specialists look for cash flows (not profits) that will give them the rates of return that they have promised to their investors, and nothing else.
For all these reasons, comparing valuations between a group of companies and trying to discern patterns that might account for them is a disreputable thing to do, though that won’t stop you finding magazine articles, blog posts, newspaper articles and stockbroker research doing exactly that.
And nor will it stop us doing it, together, for the FATMAAN companies now in this article.
Sales multiples
The first thing that we are going to do is to rule out P/E ratios. Infrastructure investors have not the faintest interest in any measures of profits, being concerned only with the cash flows that their investments deliver. As we saw in our article on Netflix, that company claims around $1.9b of net income, but it is recognising only gradually in its income statement its prodigious spending on new shows, with the result that its cash flow is around $3.1b negative. Besides, P/E ratios are the most commonly used metric in brokers’ research and news articles, and Pier Analysis can say more distinctive things if it looks at other measures.
In the absence of earnings, we examine sales to see how well it can explain the different valuations of the FATMAAN companies.
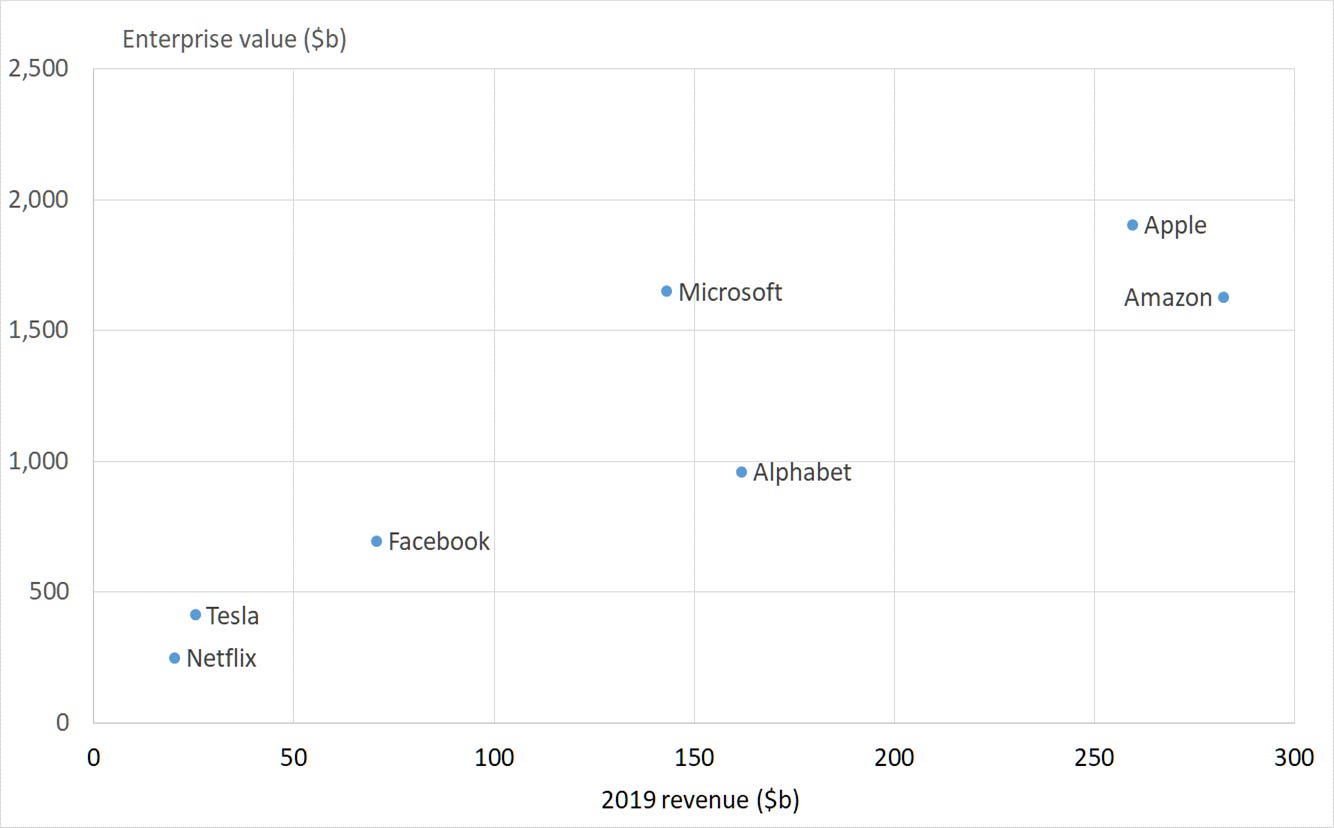
We can see that the companies line up reasonably well. The ones that sell more are worth more. A couple don’t perfectly follow the pattern; we will come to them in a minute. But for now, the trend is close enough that we can begin to think of looking at these companies’ sales multiples, that is, their enterprise values expressed as a multiple of their revenues. This is a measure of the slope of the line that lies closest to the data points, as well as passing through the zero point.
These sales multiples vary from 4.6x for Amazon to 11.6x for Tesla. And if we plot them against the revenues of the businesses, we can see that the smaller firms have higher multiples, and the larger ones have smaller ones.
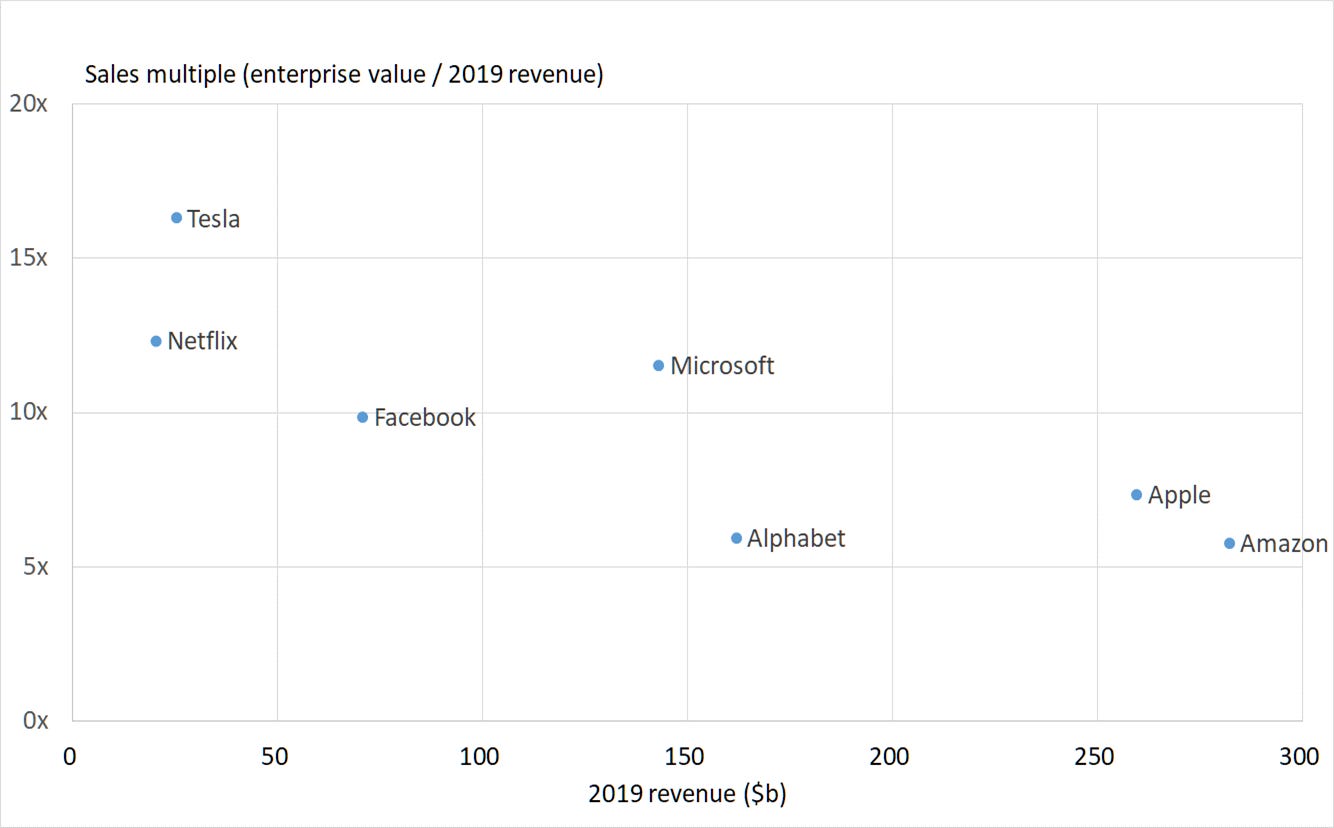
Two questions come of this chart.
Why does Microsoft attract a higher multiple than Alphabet, when the two have comparable revenues?
Why does Apple attract a higher multiple than Amazon, when their revenues are within 10% of each other?
We’ve already seen one possible answer in our last article. It demonstrated clearly that business with larger revenues have lower growth rates. If investors realise that companies find it hard to maintain formidable growth rates as they get bigger, it would be rational for them to prize the giants less than the newer smaller firms.
To test this, we redraw the previous chart so that it still shows how the sales multiple varies with revenue, but this time we make the size of the circle representing each company proportional to the company’s recent revenue growth rate.
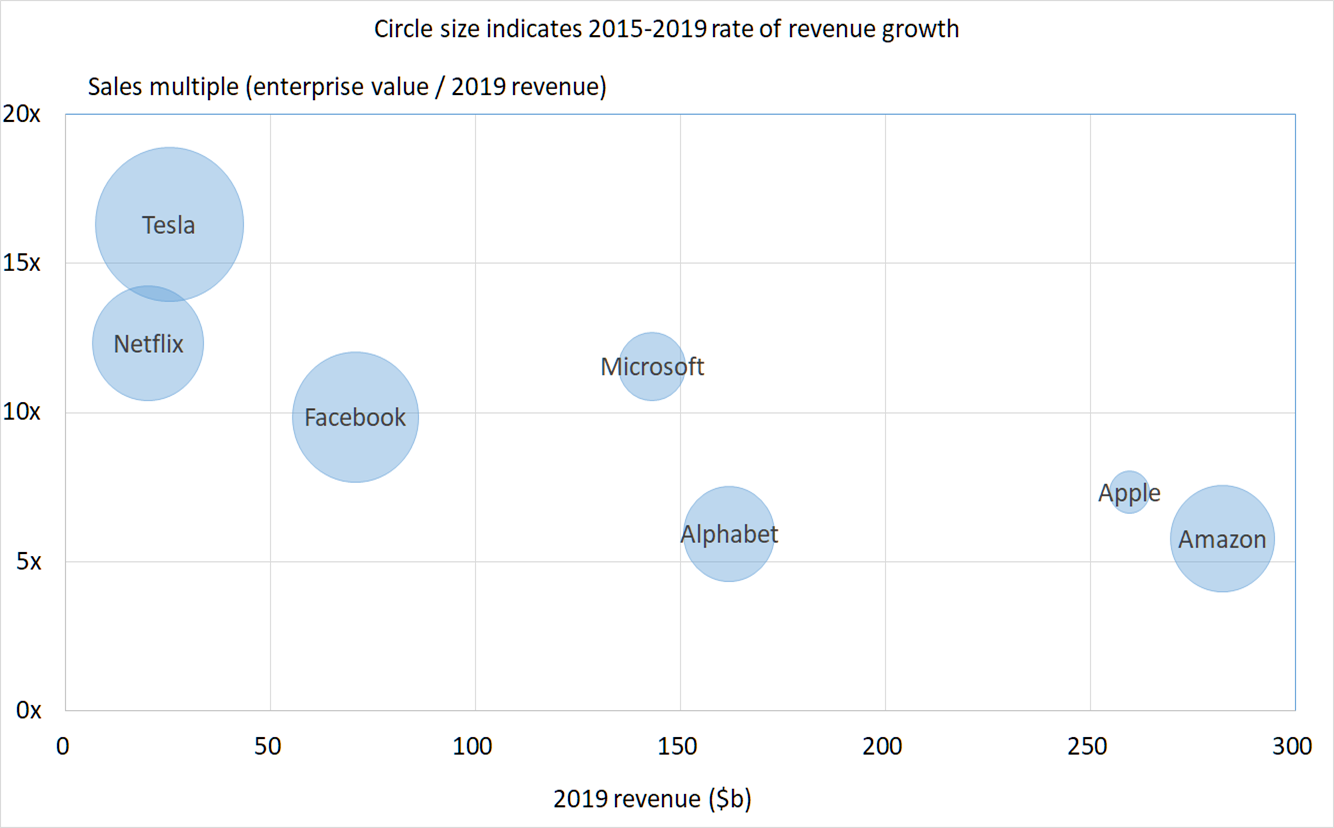
Several things stand out.
Apple has the smallest growth rate of the group; it is barely growing at all. Even so, it sells on a multiple of revenue greater than Amazon’s, which is both larger and faster growing.
Microsoft attracts twice the sales multiple of Alphabet, even though Alphabet is growing faster.
Tesla shows the highest sales multiple, consistent with it having the highest growth rate.
One possible conclusion is that Alphabet and Amazon are cheap ways to buy growth compared with their peers. An alternative interpretation is that revenue growth in recent years is not a helpful explanation of why investors pay more for some companies than others.
We concluded our last article by examining how these companies varied in terms of their effectiveness in turning revenue into cash flow [2]. To test this, we redraw the previous chart so that it shows how the sales multiple varies with revenue, as before, but this time has circle sizes proportional to the percentage of revenue that falls out as cash flow.

The circle for Netflix is red because its cash flow is negative. While Microsoft spends 74% of its revenues on cash costs, capital expenditure, working capital and taxes, keeping 26% as cash flow available to shareholders (and lenders, but it has hardly any debt), Netflix spends 115% of its revenues, leaving the providers of finance with a funding requirement instead of any kind of surplus. Until 2019, Tesla too would have had a red, negative circle.
The other anomalies that were visible in the growth chart have disappeared in this chart.
Apple attracts a higher sales multiple than Amazon, consistent with it generating proportionately more cash. Apple is widely described as a cash flow machine.
Microsoft is valued twice as highly as Alphabet, but hangs on to much more of its revenue in cash flow terms.
The way we choose to interpret these results are that
the prices of Tesla and Netflix are simply irrational, the result of a widely reported speculative bubble
the prices of other companies are consistent with their cash flow generation.
Cash flow multiples
This last point should hardly be surprising. When we plot companies in terms of their revenues, and then show, through the size of the circles, what fraction of the revenues survive as free cash flow, we are in effect considering the free cash flows in absolute terms. Pier Analysis has long claimed that valuations ought to be linked to free cash flow, and here it looks as if they actually might be.
So let us do for cash flow what we did in the last section for sales. We start by confirming that cash flow is a plausible predictor of enterprise value.

It looks as if it is. The larger a company’s cash flow, the larger is its enterprise value, with just Facebook out of line.
This being so, we can begin to think of a price to cash flow multiple, and start plotting that to see if there are any patterns.
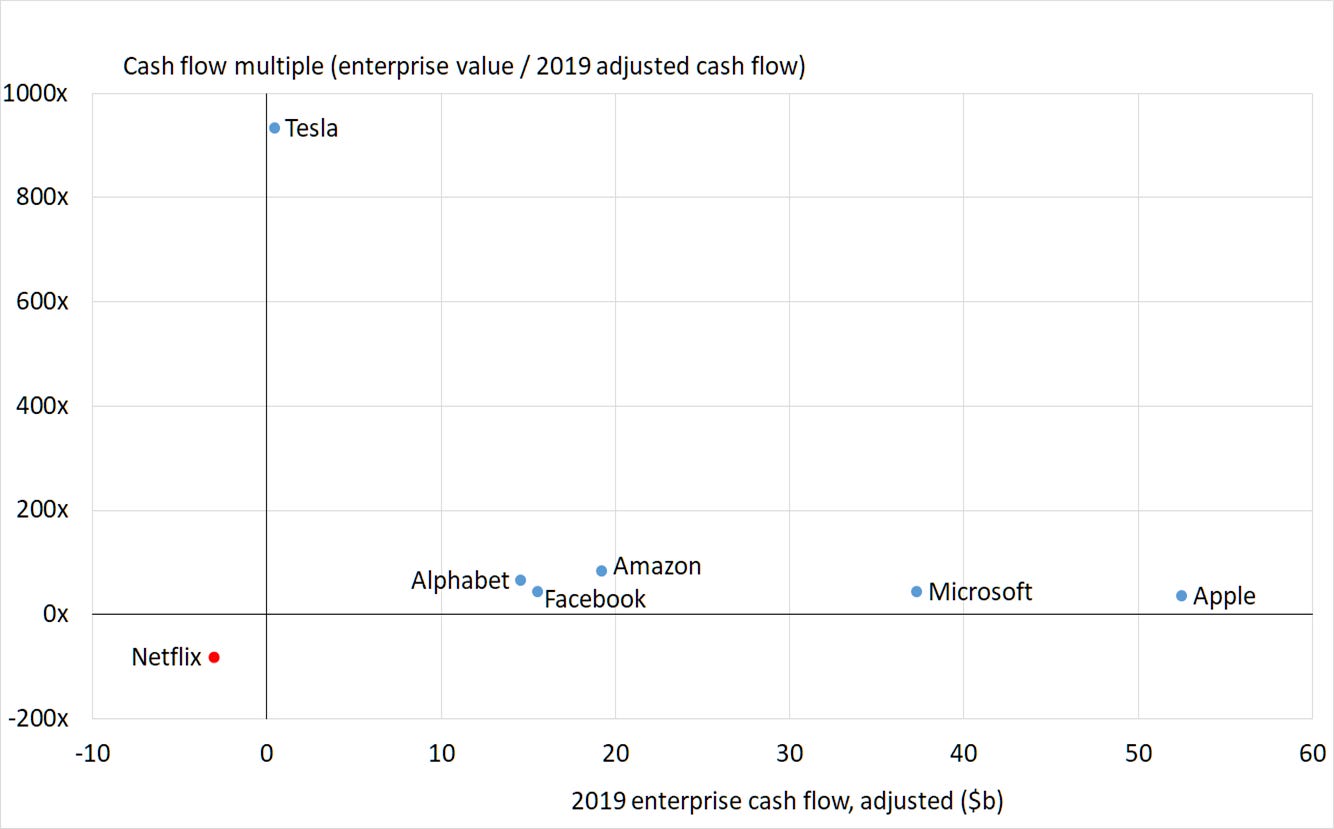
Our first attempt reminds us that for Netflix the metric is meaningless, because the company doesn’t generate any cash flow; and shows us just how stretching is the Tesla valuation.
Let us eliminate those two for clarity and zoom in on the ones that remain.
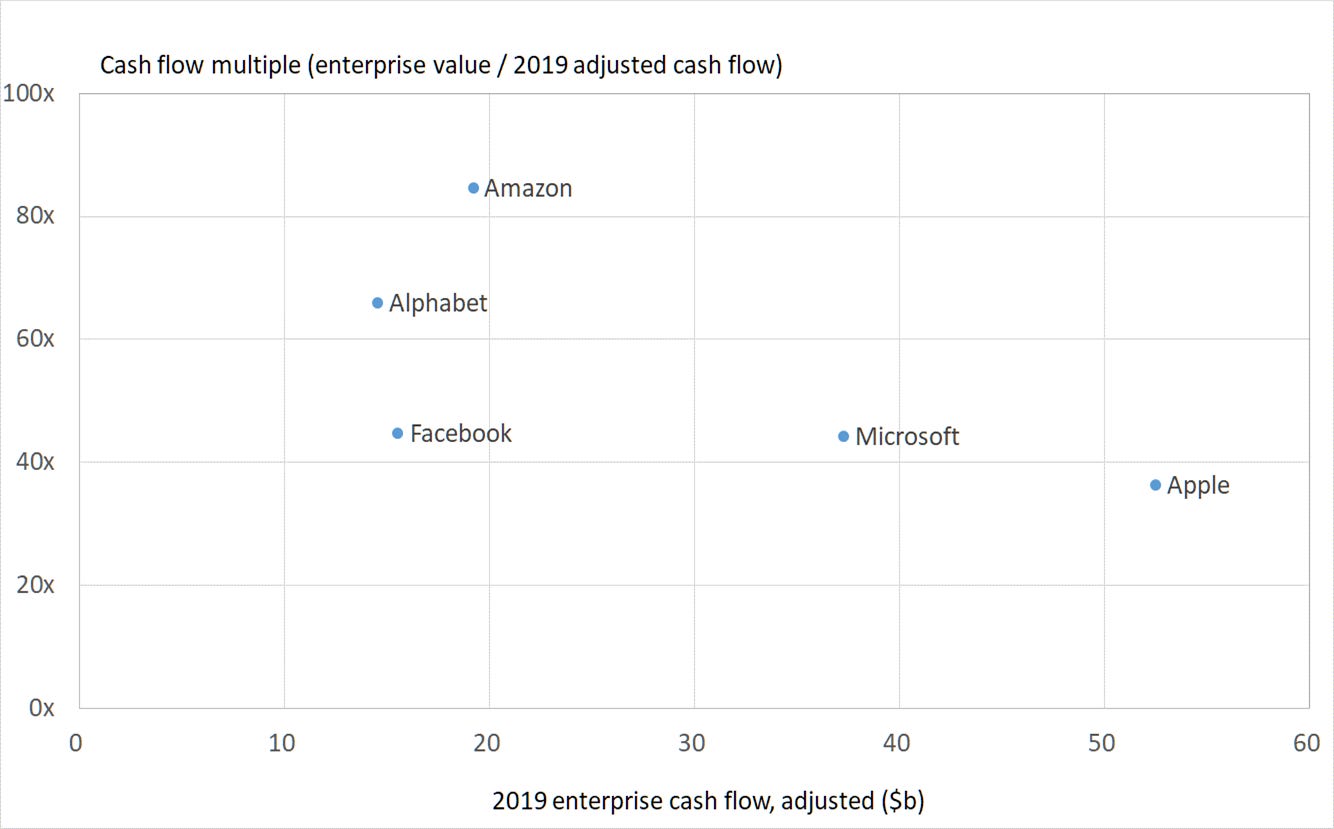
We can see that these businesses have enterprise values in the region of 40 to 80 years’ worth of current cash flow, and that those price to cash flow multiples decline steadily as the cash flows increase.
If we repeat our earlier trick of varying the size of the circles to show the revenue growth rates, we can see that the decline in multiple is linked to the growth rate.
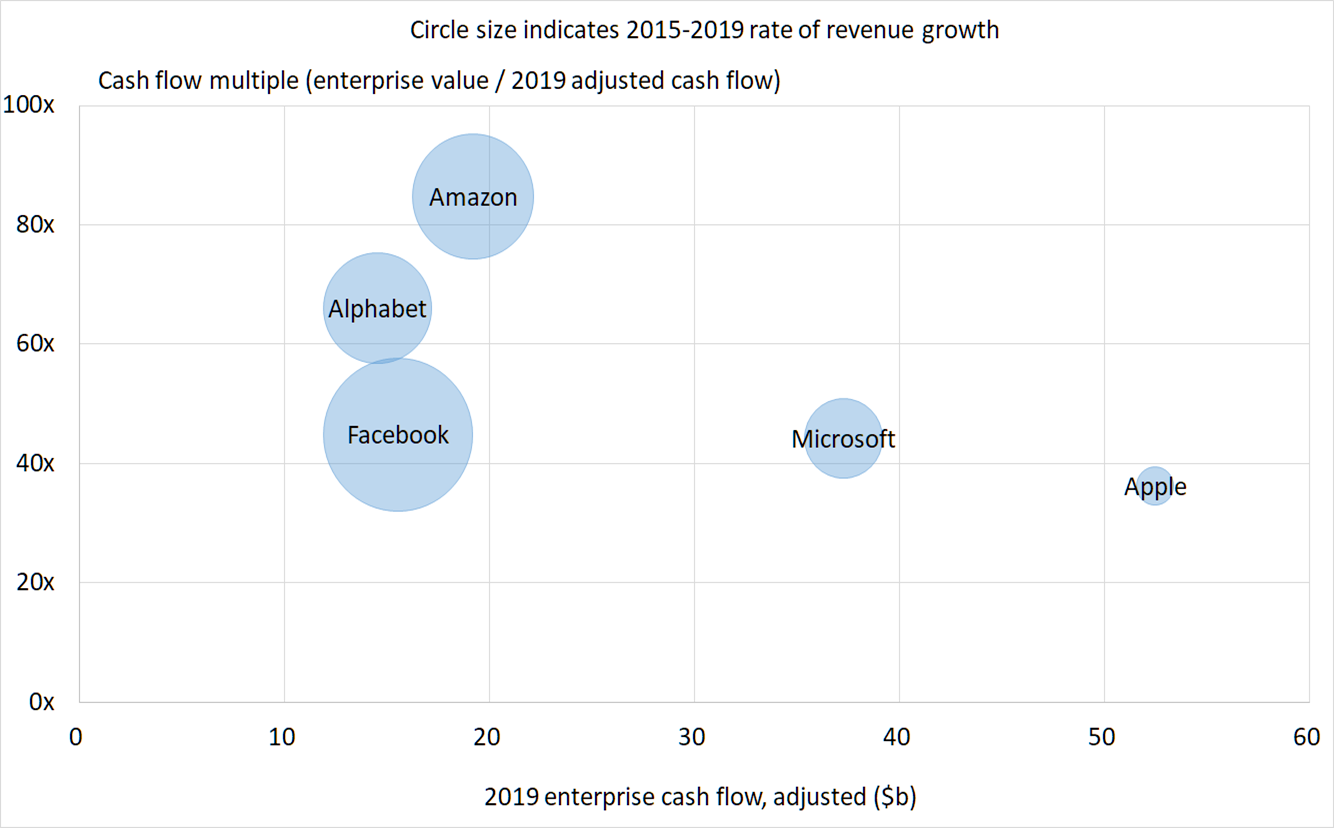
Investors pay more for high growth companies; it is easier for smaller companies to grow rapidly than large ones; therefore investors pay more for the smaller companies in terms of this price to cash flow multiple.
Spending for the future
As we saw in our last article, the FATMAAN companies vary widely in their capital expenditure, which we can see as the companies investing in their own future. As a portion of revenue, Apple devotes 4% and Facebook devotes 20%. Alphabet outspends Microsoft by 40% in dollar terms.
A dollar spent on capital expenditure is a dollar that won’t make its way to cash flow, at least not in the year in question, though clearly the dollar is spent with the expectation of earning back many more of them in future years. There is a tension between this investment and generating the free cash flow that investors clearly like.
Whether investors are giving appropriate credit to the efforts companies are making to realise new products and services is perhaps the subject of another article, but it won’t be for some time because the question is academic at current elevated valuations.
Conclusion
Though widely taught and used, relative valuations suffer from various drawbacks, chief among them the possibility that they don’t recognise when a whole cohort of shares is valued at unrealistic levels. There are no circumstances at all when they are used by competent specialists in infrastructure investment.
As we have seen in the articles addressing the members of this particular group of companies individually, their valuations can only be rationalised in terms of long time periods during which who knows what will happen; tolerating low rates of return; and very optimistic expectations of the future.
That said, if you must take a technology stock at current valuations, the one that stands out is Facebook. Compared with its peers it is investing more in the future in terms of capital expenditure, and yet still manages to come out with higher than average cash flow, and it is growing faster than any of the others except Tesla.
The new tobacco?
It is open to question why Facebook is more cheaply rated than the others.
Remember that Mark Zuckerberg personally controls the company in terms of votes. Alphabet too has a share structure tilted towards insiders. Apple, Microsoft and Amazon have more nearly conventional governance structures.
Facebook will be particularly exposed to the politics of the next few weeks. In the longer run, among these companies it is the one that probably has its head highest above the parapet in terms of regulation.
Not everyone considers that Facebook is making the world a better place. At intermittent intervals, news reports emerge of senior executives resigning due to concerns in this direction. Anyone thinking of buying the shares may find it a good idea to read Roger McNamee’s Zucked: Waking up to the Facebook Catastrophe. Against that, you can probably find a book that is rude about every one of the companies in this list.
Let’s accept for a moment that Facebook has some questionable aspects. Are you content to invest in tobacco? Coal? Oil? Healthcare? Baby food? Where does Facebook fall in this continuum, and where do you draw the line? These are questions that will be answered differently by every individual. Anyone who cares to offer an opinion on this subject is welcome to do so, by simply replying to this email, or writing to pieranalysis@substack.com.
What next?
If you find this analysis interesting, you can sign up to have others like it delivered to your inbox several times a month.
Share Pier Review with interested friends.
Notes
[1] Actually, this is not perfectly true: at a conference, a fund manager who had moved into infrastructure from another discipline sought to justify a recent investment on the basis of EBITDA multiples rising in the sector. He was greeted by open laughter.
[2] Throughout this note, the cash flow we are referring to is what Pier Analysis calls enterprise cash flow. A more common name for it is free cash flow, but unfortunately a minority of people use that term to mean a variety of different things, none of them consistent with the most common use. Because of this ambiguity, Pier Analysis uses the term enterprise cash flow. It is what remains after all cash expenses are deducted from revenue, including operating costs, capital costs, cash absorbed by working capital and taxes. It is what is available for distribution among the various providers of finance, in the form of interest, repayments of debt, dividends and share buy-backs.
The enterprise cash flow that we are here showing in the charts is adjusted to strip out one-off items that are unlikely to recur, in pursuit of a measure that indicates the underlying cash generating ability of the business.