
Apple
Apple is priced as a growth stock. It would be great if it was actually growing.
Shrinking cash pile
Apple famously had amassed over a quarter of a trillion dollars by 2017 (the green line at the top of the graph below). What was not so famous was that even then, it has $116b of borrowing (the red area), making its net cash just $153b (the blue area between the green and red). Now, the company’s net cash is down to $98b.

Enterprise value
That its cash is shrinking is no criticism of Apple. As we will see, the company has returned a large part of its cash pile to shareholders, through an extensive programme of buying back its own shares. We look at the cash for one reason only: we need it to know how much holders have at stake in the company. We can say that the company has $98b of net cash, or minus $98b of net debt.
We combine this negative number, the value of the company’s debt, with its market capitalisation of $1370b, which is the value of its equity. Together, these give us the Enterprise Value of Apple, at $1272b.

From this point on, we will drop the $b symbols. All amounts that follow are in billions of dollars.
What we demand of the future
Anyone buying shares in Apple is handing their hard-earned cash today in exchange for some proportion of this 1272 of enterprise value. That is a sensible thing to do if what Apple will deliver in future is at least as large as this 1272; if Apple will generate cash flows of at least 1272, available for return to stakeholders, and additionally reward them at a rate that compensates them for tying up their money in the firm and taking the risk that the company might stumble.
For Pier Analysis, this rate of return has to be at least 10%. Two reasons for this.
While Apple has done well since the iPhone was launched, there is no guarantee that that success will be everlasting. Look at Nokia, and Blackberry. Even Apple did badly for a period in its history, and had to be bailed out by Microsoft. There are risks attached to every investment opportunity, not just Apple.
10% is a reasonable opportunity cost for ordinary investors, since one can get that kind of return from funds invested in diversified portfolios of infrastructure projects, the revenues for which are backed by national governments. These are the kinds of investments that the team behind Pier Analysis have spent a lifetime analysing, and it is instinctive for us to see them as a a viable alternative use for any cash that we may have spare.
One way Apple could reward stakeholders at a 1272 valuation is to generate 127 of cash flow. This would obviously provide the 10% target return, but only if the 127 recurs every year. For ever. Another way to say it is that we get our 10% reward every year, but repayment of our original investment is deferred, for eternity.
Real companies don’t last for ever, and Pier Analysis is not willing to wait that long. We choose 15 years as the period over which we wish to receive not only our 10% reward, but also the return of our stake in the company. For this to be achieved, the cash flow Apple needs to generate is quite a bit higher than the 127 just mentioned (10% of the 1272 enterprise value). The requirement is more like 160 to 190.
Growth
We have just seen that if we want to be confident of seeing the return of our share of Apple’s 1272 of enterprise value, and a 10% return on that investment, all within 15 years, we need to believe that Apple can generate cash flow around 165-190 per year.
This pattern is the violet line in the chart below. But it’s not the only profile that would generate the required present value. We could start much lower, so that we were well below the violet line in the beginning, as long as we made up for it by growing very fast, to the point where we became much higher than the violet line at the end of our 15 year period. The red lines do this, with the other colours somewhere in between.
Since we are unwilling to rely on companies lasting much more than fifteen years, we concentrate most of the growth in the first five years. This too is demanding by conventional standards. The models that Pier Analysis provides to illustrate its arguments give subscribers the opportunity to investigate their own, different assumptions.

Any one of these patterns would put Apple in the position to return our investment within fifteen years and give us a 10% return. Technically, what we are saying is that the 15 year cash flow profiles shown in every one of these lines has a net present value of 1272, when discounted at our chosen rate of 10%. If the cash flows that Apple generates in the future follow one of those lines, the benefits of holding shares in the company (our entitlement to our share of these cash flows, discounted back to today) match the cost of buying those shares.
Recent history
Now that we know what Apple needs to achieve to reward us appropriately and return our capital to us, we can look to see what the company has actually managed. The black lines in the graph above show what Apple’s enterprise cash flow looked like in the last five years. There’s a dotted line, which is what the accounts show; and a solid line, which reflects what the cash flows would be when subjected to some necessarily subjective adjustments aimed at stripping out items that are unlikely to recur in the future.
We can see that Apple’s cash flow has been hovering between 40 and 60. It is way below the violet line, and has no prospect of suddenly leaping to that. More plausible is the idea that it could grow from today’s levels, following the red profile. That would require the cash flow to grow by 30% every year for the next five years.
There are plenty of growth stocks whose cash flows have grown at 30% a year over a period of years. Apple was one of them, once. Over the last five years, however, its cash flow has shrunk, from 64 in 2015, to 56 in 2018, to 51 in 2019.
Unorthodox assumptions
Our analysis rests on the two key criteria that we have just introduced, which differ markedly from conventional thinking.
The 10% that we require as our rate of return is a much higher threshold than most investors are looking for in Apple. Many argue that the correct rate for this remarkable company is closer to 2% , demanding little premium over current bond yields.
15 years is a much shorter payback period than most investors demand. The way business school students are taught to value businesses is equivalent to waiting for an infinite number of years.
This isn’t our outlook. The role of Pier Analysis is to bring the mindset of infrastructure investors to the analysis of well known companies. No infrastructure investor would accept a 2% yield, nor imagine that their asset was infinitely long-lived. And we are looking for opportunities with a considerable margin of safety, which you don’t get if you set your cost of capital close to zero and wait for as long as it takes to get your money back.
You are free to disagree. If you do, you can substitute your own assumptions, because top of the list of what is distinctive about Pier Analysis is that it provides the models to illustrate its arguments, for you to examine and interrogate. If you choose to, you can set the discount rate to a much lower figure, and the investment period to 50 years or more, which is close to the infinitely long horizon implicit in conventional analyses. Then you will be able to see what Apple looks like from the perspective of analysts in brokers and banks.
If we set the required return to a rate lower than 10%, and the asset life to longer than 15 years, the model will redraw the coloured lines considerably lower than shown above. Under those conditions, it will be less of a stretch to believe that those lower lines are plausible extrapolations of the black lines, which being derived from historic values in the published accounts, won’t shift when these assumptions are adjusted.
No subjectivity
With one exception, no judgement is involved in drawing any of these lines on this graph.
The black lines are derived from the accounts, the dotted one exactly so, the solid one adjusted (this is the exception) to make it more representative of what Apple can deliver on a recurring basis
The coloured lines are the consequence of mathematics, and have the magnitude and contour to deliver the required 1272 net present value at growth rates in the first five years of 0% to 30%.
The only subjectivity required is in the reader, working out whether any of the coloured lines are plausible extrapolations of the black ones.
Making money
These historic figures are taken from an analysis in the model that displays the cash flows in a direct form. It is laid out simply, as children would lay out an account of how they had done with a lemonade stand. It starts with revenue, deducts costs, and eventually at the bottom is what is available for the lemonade entrepreneurs to take home. Compared with this, the cash flow statement in a company’s annual accounts, which follows a more technical indirect format, is close to impenetrable. Studying this may give us a guide to what Apple could plausibly accomplish in the coming years.
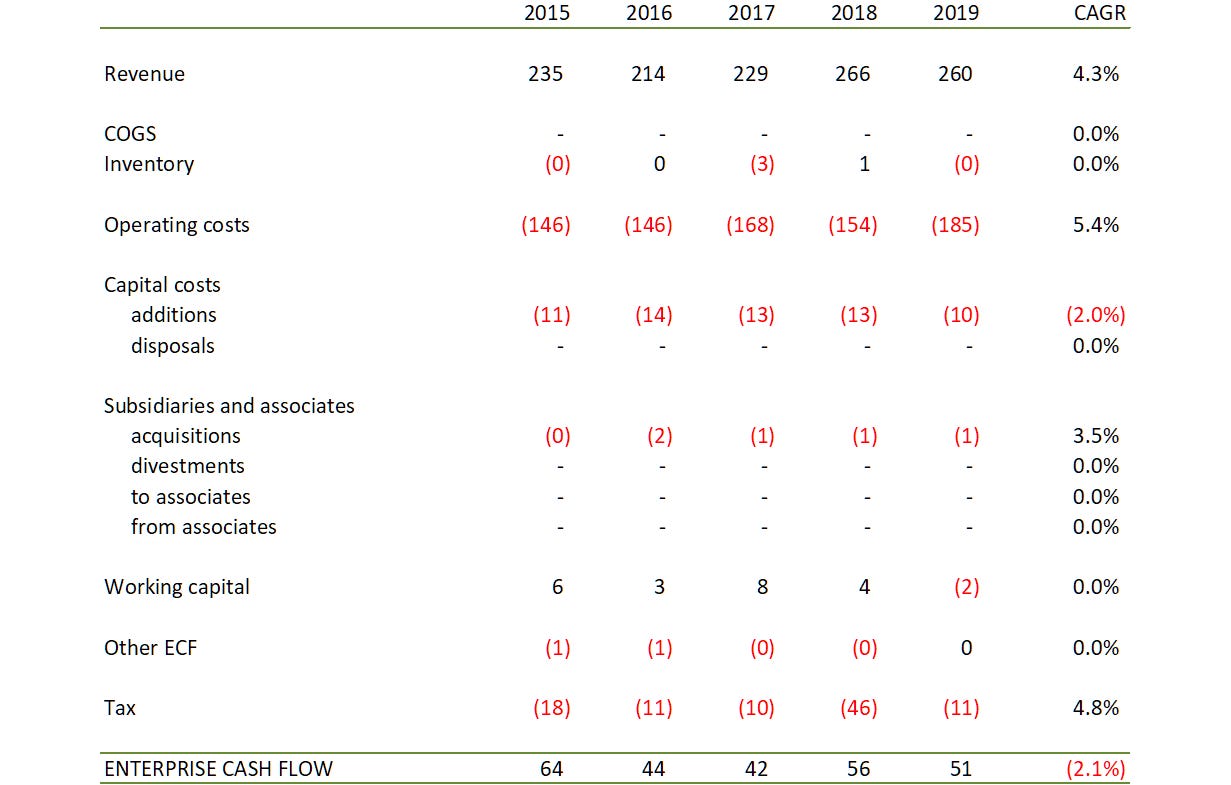
We can see that Apple’s revenues have grown from 235 to 260, a best-fit CAGR of 4.3%. Over the same period its cash operating costs have grown faster, at 5.4%. In addition, working capital flows, which were modestly beneficial, have gone into reverse. As a result, the firm’s enterprise cash flow is stuck between 42 and 64. The onus is on anyone who thinks it might break out of that range to explain what physically will cause it.
Spending and saving money
What is more interesting is what Apple is doing with this cash flow.

The company is paying out around a quarter of its enterprise cash flow in dividends. At today’s high share price, the dividend yield is just 1%.
This was not all that Apple gave to its shareholders. The line above the dividends showed that in 2018 and 2019 it paid out four of five times as much again to them in a different form: it was buying back its own shares. It has been doing this for some time, and since the amounts involved exceed the cash flow it is generating, Apple has
borrowed the money (the line marked senior principal)
raided its stash of marketable securities (the line marked Other FCF)
When a company has more cash than it knows what to do with, returning it to shareholders is a sensible thing to do, not least because some shareholders complain loudly that they would like to hold these amounts directly in their pockets rather than indirectly through their holdings in the company. More for debate is whether it is fairer to return it as dividends, where it is shared between all shareholders, or through buybacks, where it ends up in the hands of shareholders who choose not to stay with the company, and benefits faithful remainers indirectly, by increasing the fraction of the business that they own.
If you choose to think of both the dividends and buybacks as different forms of the same thing, the yield on the two kinds of distributions to shareholders combines at a striking 5.9%. Before being too impressed, recall that it will only last for as long as there is net cash begging to be distributed, and a third of that net cash has been handed out in just two years.
Conclusion
To be a buyer of Apple’s shares at today’s prices, you need to
have reason to believe that something is about to make its cash flows break out of the 42-64 band of the last five years
accept lower rates of return than Pier Analysis’s 10% pa
be willing to wait longer than the 15 years Pier Analysis considers
follow the upward momentum of the share price of Apple and other tech stocks, recognising that it has little connection with fundamental analysis, and remain hopeful that you can get out before others if the tide turns.
A reasonable objection to this analysis is that under these criteria very little will be worth buying at today’s valuations. That’s true, and by design.
Though they are highly rated now, in the last decade each of Google/Alphabet, Apple and Microsoft has had periods in which the share price was low enough to satisfy these criteria, from which they have since grown by five times or more.
What next?
A distinctive feature of Pier Review is that it provides the financial model that underpins each analysis. If you are content with a return less than 10%, or willing to wait more than 15 years for the return of your investment, you can impose less demanding requirements and see how the coloured lines on the projection of cash flow required to justify the valuation shift downwards. (The black lines on the chart will not move, since they are the result of Apple’s reported historic performance.)
To receive the spreadsheet
if you have not done so already, subscribe to Pier Review by using the box below
click here to pre-populate a message in your usual email program requesting that the spreadsheet be sent to you
switch to your email program and click Send to despatch the request.
If you find this analysis interesting, you can sign up to have others like it delivered to your inbox several times a week.
Share Peer Review with interested friends.