
Comparing fat men
The fashionable tech stocks are more varied than you might expect
With our last article we completed coverage of the FAATMAN stocks:
That puts us in a position to compare these businesses.
Our comparison takes two forms.
The first, which is legitimate, concerns what patterns we can discern among these companies as businesses.
The second, which is much less respectable, will look at how they rank as investments.
Some growing faster than others
The current high valuations of these companies are essentially bets that they will continue to grow very rapidly. However, when we examine how fast their revenues are actually increasing, we see that they vary considerably.

This material is easier to absorb graphically.
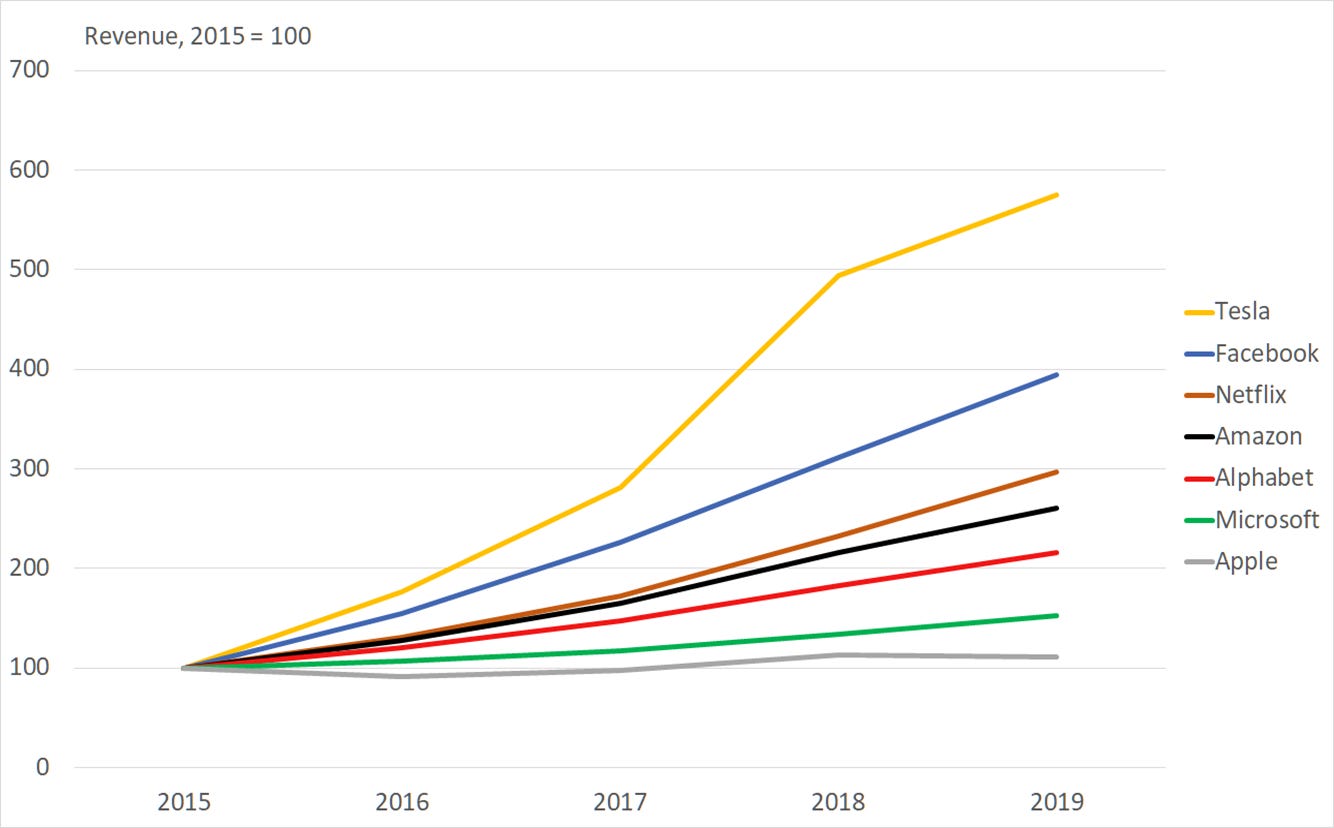
We can see that
Tesla’s revenue is nearly six times what it was five years ago, equivalent to a growth rate of 57% pa
Amazon’s revenue is 2.6 times larger over the same period, a growth rate of 27% pa
Alphabet is growing twice as fast as Microsoft, and overtook it in terms of turnover in the latest financial year
Apple’s revenues are up only 11% over the same period, equivalent to 2.5% pa, which is little more than inflation.
As we said in our article on the company, Apple is priced like a growth stock, but it is not actually growing. It’s the only one of this group to be growing at less than 10% pa. In this financial year, which has just ended (Apple has an end of September year end), it has a good chance of doing better: results for the third, most recent, quarter showed an 11% revenue rise compared with the comparable quarter in 2019.
The result is that Amazon has now overtaken Apple in terms of turnover, and Apple’s share of the revenue of this group has fallen from 43% to 27%.

We can amuse ourselves by seeing what happens if these growth rates continue.

This graph is plotted on a log scale to make it easier to read. That choice causes the lines to be straight rather than curved, showing that we are holding the growth assumption of the next five years at a constant rate equivalent to whatever these companies achieved over the last five years. On this basis
Alphabet will join Amazon in becoming larger than Apple in three years
Facebook will do it in four years
Tesla will achieve it in five years
Microsoft will do so in eight years
In eleven years, Apple will be the smallest of the group, smaller even than Netflix.
Growth becomes harder as you get bigger
The likelihood that these businesses will maintain exactly the same growth rates in the future as in the recent past is of course negligible. Events will conspire to perturb that pretty pattern. Even if they don’t, big companies find it impossible to grow as fast as small ones. Within this group, the pattern is clear, with Amazon alone the outlier, growing much faster than its size suggests it should.

Those who are making bets that companies can continue current growth rates for a long time are likely to be disappointed.
Valuable residues
Growing revenue is useful only if leaves a growing residue after meeting costs. Most discussion would measure this residue in terms of profit. Pier Analysis is more interested in cash flow, as that is the focus of investors who specialise in infrastructure, and it is their mindset that Pier Analysis is seeking to bring to the examination of companies.
We might hope that our cohort’s cash flows are growing faster than their revenues, since we can reasonably expect that variable costs will go up more or less with the volume of business, and fixed costs will change little if at all. In practice, as anyone who has run a business is all too aware, costs have a displeasing habit of rising faster than revenues as the complexity of managing it increases.
It is not meaningful to compare the growth rates of cash flow of the FAATMAN companies in the same way as we did the revenues, because five years ago half of the group had cash flows that were negative.

What we can say is that
the total cash flow generated by the group has risen by 43% over the period
Apple’s share of it has shrunk from two thirds to one third, 68% to 38%
the share of Microsoft, Facebook and Amazon has moved from a quarter of it to a half, 24% to 52%.

The cash flow we are talking about is what Pier Analysis calls the enterprise cash flow. It’s the result of taking revenue and subtracting from it all operating costs, capital costs, requirements for working capital and taxes. It measures what is available to be shared between lenders, in the form of interest and repayments on borrowings, and investors, in the form of dividends, or, in this group of companies, share buy backs. When it is negative, it will be up to those providers of funds to meet the shortfall. A more common term for this quantity is free cash flow. Unfortunately, some people use free cash flow to mean other things, leading Pier Analysis to prefer the less common but less ambiguous term.
The enterprise cash flow shown here has been adjusted, that is, items that Pier Analysis judges to be unlikely to recur have been stripped out, with the intention of gaining access to a measure of the firm’s underlying cash flow. Details of these adjustments are set out in the articles on the individual companies.
How these businesses spend their revenues
In the following graph, the positive portion of each company’s bar represents its revenue.
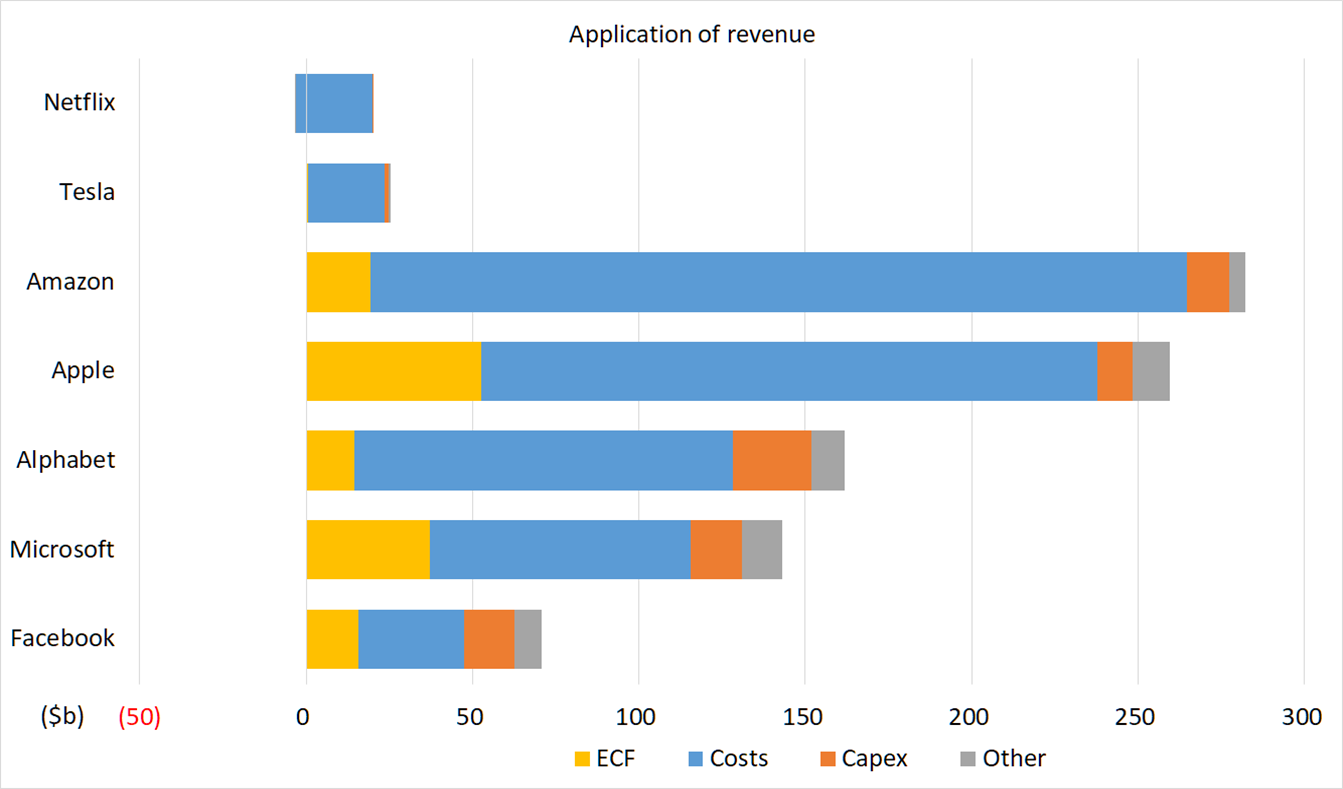
The different coloured parts of the bar show how the revenue splits between operating costs, capital costs and other items. Whatever is left over is enterprise cash flow.
Netflix is a good deal smaller than the giants. It illustrates why cash flows are more interesting than measures of profit. Netflix claims to be making $500m pa in profit, but its cash flow is negative as it is spending more on content generation than it earns in revenues.
Tesla is the next largest, and has cash flow of essentially zero.
The others all throw off substantial cash flow
Alphabet, Amazon and Facebook all outspend Apple on capital expenditure
If we scale the bars so that they are all the same length, we can see how the costs vary as a percentage of revenue.
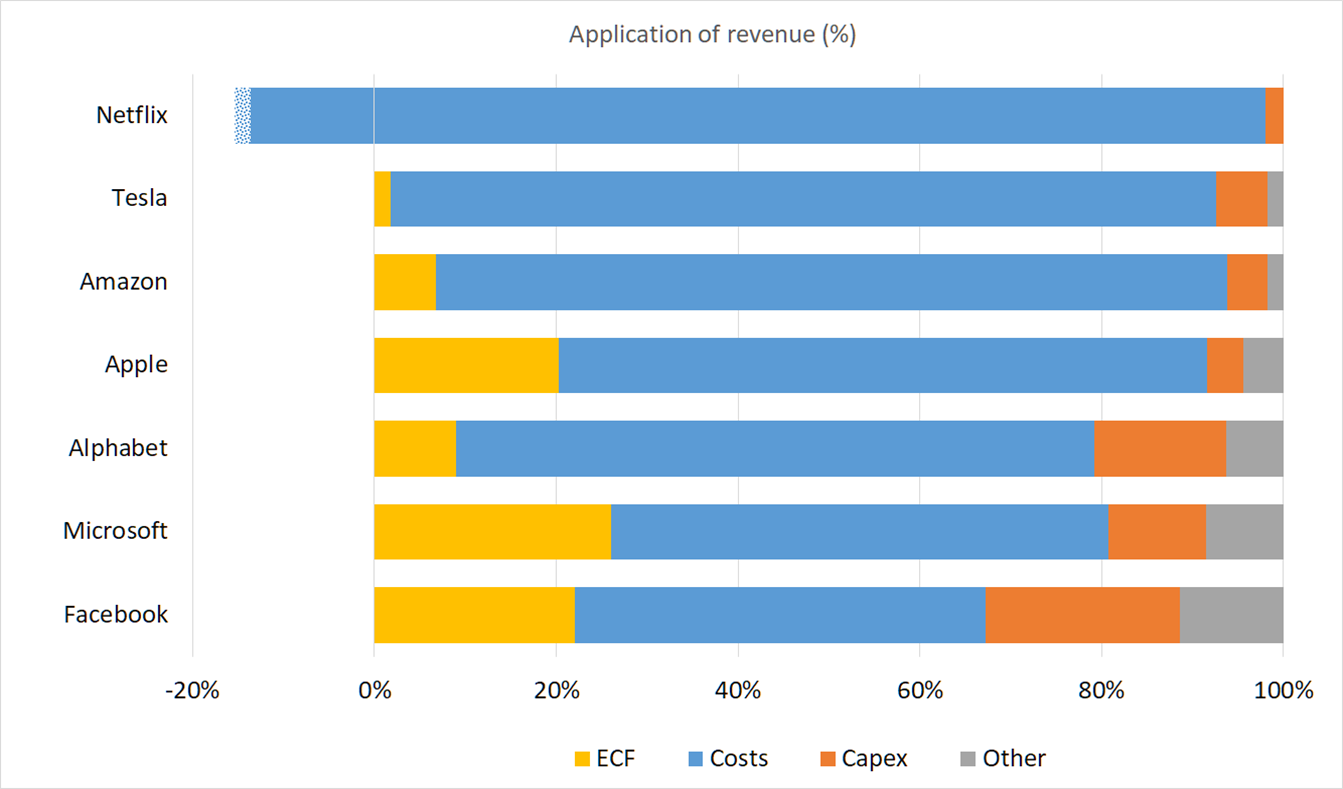
The blue parts of the bars represent cash operating costs.
The blue bars of Tesla and Amazon consume a large proportion of revenue, because they are shipping physical product which they have to buy in and, in Tesla’s case, assemble
The blue bars of Microsoft and Facebook are smaller, because their products are digital, and cost nothing to buy, assemble or deliver physically
Apple is between these two extremes, with a mixture of physical and digital output. So, slightly surprisingly, is Alphabet.
Netflix’s costs are 17% larger than its revenues. 2% of those costs are covered by working capital inflows, indicated by the lighter blue edge to the bar.
What stands out is how much of Facebook’s revenue turns into enterprise cash flow, in spite of it devoting proportionately more of its revenue to investment in the future through capital expenditure than any competitor. As we saw earlier, Facebook is second only to Tesla in its growth rate.
Value-free analysis
Our investigations so far have been drawn from the accounts, and look at revenues, costs and other components of cash flow. There is not much that is subjective or can otherwise be argued about. In our next article, we will combine these findings with current valuations, and see why that is a more fraught and less respectable thing to do.
What next?
If you find this analysis interesting, you can sign up to have others like it delivered to your inbox several times a month.
Share Pier Review with interested friends.