
Netflix
An outlier or an imposter?
The leaders of the currently fashionable technology businesses are known by some as the FAANGs: Facebook, Apple, Amazon, Netflix and Google. An even sillier acronym is FAATMAN: Facebook, Alphabet (the company that owns Google), Amazon, Tesla, Microsoft, Apple and Netflix. Which either abbreviation you favour, with this article on Netflix we complete our initial coverage the group.
The shares of all of these companies are highly valued, to an extent that reminds some of the dot com bubble which burst in 2000. Others counter that current circumstances are not the same [1] because the internet companies of 2000 had no profits, nor any business model, nor even any sense of how they might find one. Today's technology firms may be highly valued, these people say, or even overvalued, but they are fundamentally decent businesses, generating high revenues and heroic cash flows.
Except that in Netflix's case, it isn't. Alone among these firms, its cash flow is negative and becoming more so.
Enterprise value
Let's have a look and see what the numbers tell us.
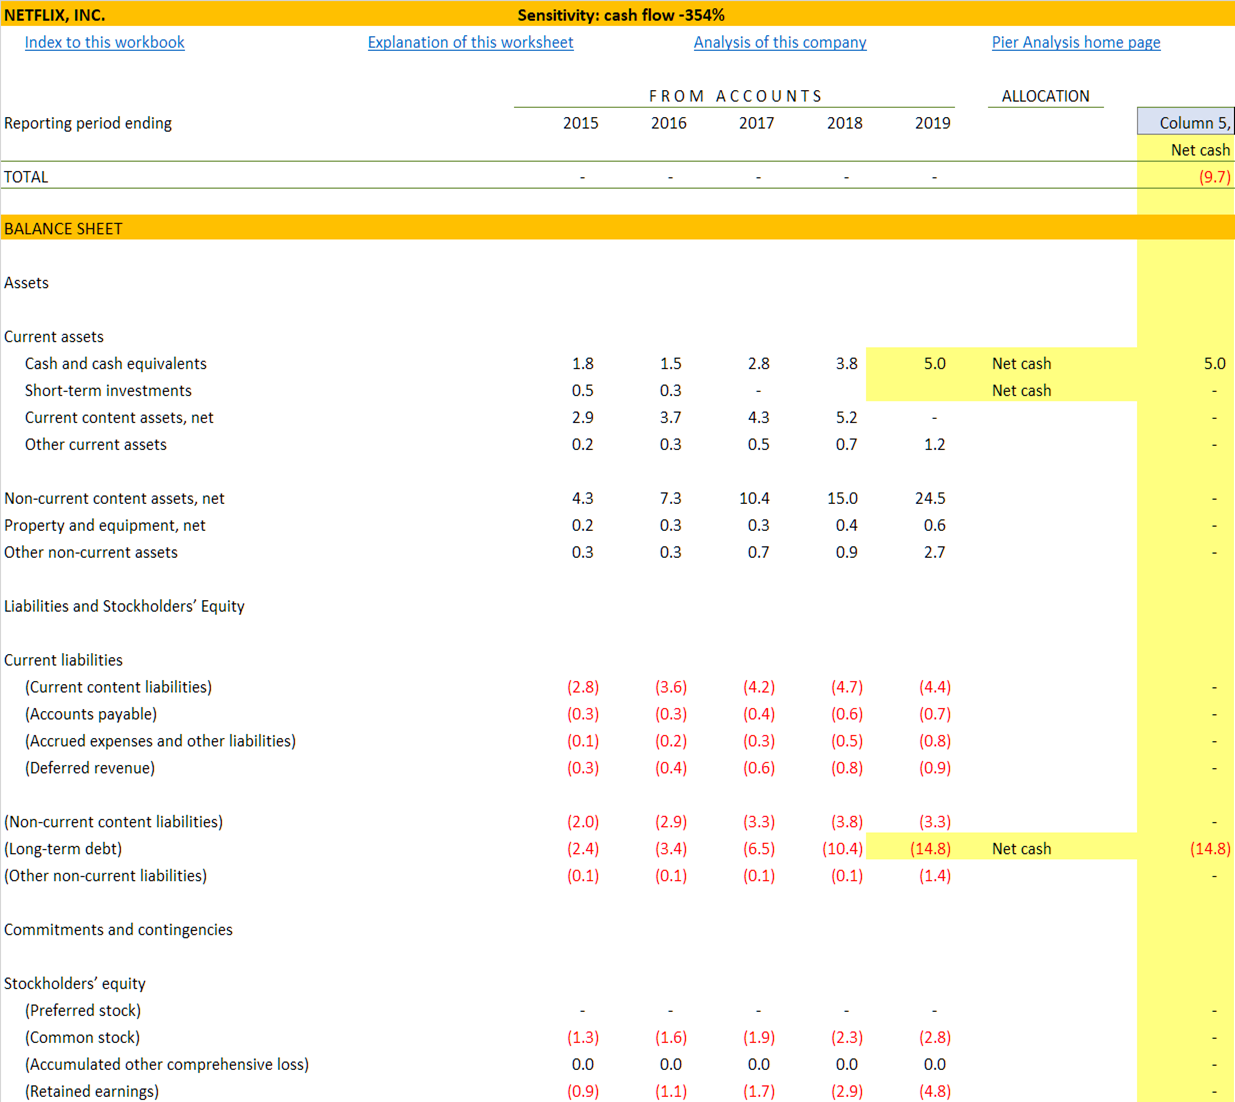
First, we go through the entries in Netflix's balance sheet line by line, to work out its net debt. We find it amounts to $9.7b.
To the amount the firm's lenders have at stake in the firm, we add what the firm's shareholders have at stake, that is, its market capitalisation. Today, that is $205b.
Take these things together, and we find an enterprise value of $214b.

Implied cash flow
Holding a stake in Netflix makes sense as long as we believe it can generate at least this much cash in the coming years. It doesn't have to do that immediately. It can take some time over it, but sooner or later we want our money back, or there is no point in us, or anyone we might sell our shares to in the future, putting our hard-earned savings into this business.
As well as generating the means for the gradual return of our capital, we want a return on it while we wait. There are countless ways Netflix could achieve this, a selection of which are shown on the graph below.
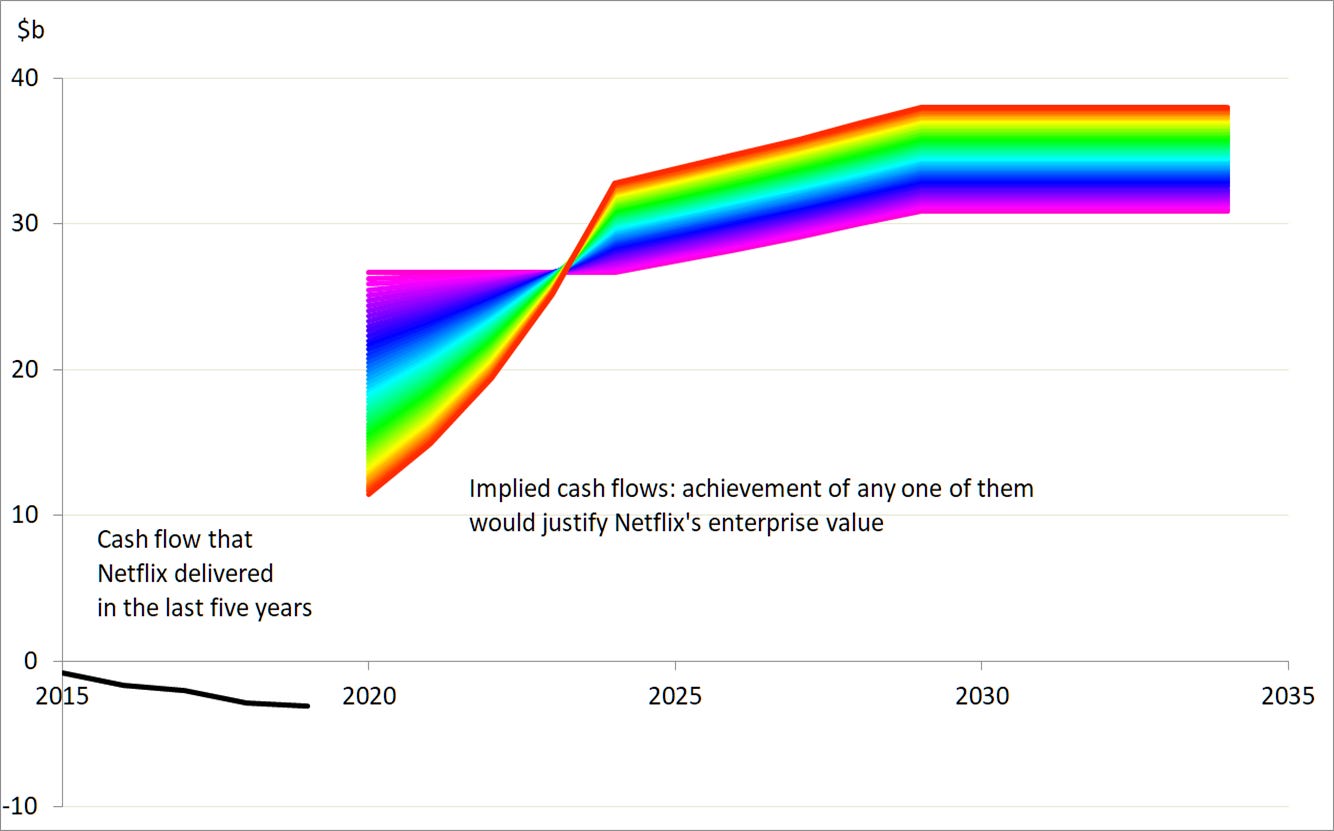
Among the range of trajectories that would do the job is one in which cash flow starts around $27b and rises gently to $31b: this is the violet line.
Another way is to deliver a cash flow that is lower than this range in the early years, say $11b, but makes up for that by growing rapidly so that it is significantly higher in the later years, reaching $38b. This is the red line.
And there are infinitely many contours between these two examples, and beyond them. Any one of the cash flow profiles shown would put Netflix in the position to return our investment within 15 years and give us a 10% return while we wait for it. [3]
Actual cash flow
Now that we know what Netflix needs to achieve to reward us appropriately and return our capital to us, let us take a look at what the company has actually achieved in recent times.
The line at the left in the graph above show what Netflix’s enterprise cash flow looked like in the last five years. We can see how this profile is built up by looking at a representation of Netflix’s cash flow. [2]

Highlighted in green: revenues have more than trebled in the five years between 2015 and 2019, a growth rate of 32% pa.
Highlighted in orange: cost of sales have risen at much the same rate. This is the result of Netflix spending heavily on new content.
Highlighted in red: enterprise cash flow is also growing at 39% pa. That sounds like a desirable property, but not when the cash flow is negative as it is here.
Highlighted in blue: cash margins are negative.
No other FATMAAN member has a cash flow that is increasingly negative. Even Tesla can claim that it has become cash positive in recent quarters. Apple's cash flow is prodigious.
You would not discern any of this from Netflix's income statement. It reported net income of $558m. This is because in any one year it puts through its profit and loss account only a fraction of what it spends on new content, whether that is produced by Netflix itself or licensed from other companies.
From Netflix’s 2020 10-K:
The Company recognizes content assets (licensed and produced) as “Non-current content assets, net” on the Consolidated Balance Sheets ... Based on factors including historical and estimated viewing patterns, the Company amortizes the content assets (licensed and produced) in “Cost of revenues” on the Consolidated Statements of Operations over the shorter of each title's contractual window of availability or estimated period of use or ten years, beginning with the month of first availability. The amortization is on an accelerated basis, as the Company typically expects more upfront viewing, for instance due to additional merchandising and marketing efforts and film amortization is more accelerated than TV series amortization. On average, over 90% of a licensed or produced streaming content asset is expected to be amortized within four years after its month of first availability. The Company reviews factors impacting the amortization of the content assets on an ongoing basis. The Company's estimates related to these factors require considerable management judgment.
Once a mine or an airport or a power station has been built, it will keep running for several decades with moderate maintenance expenditure. Cash flow, negative while the asset is constructed, quickly turns positive once it starts operating. Not so here. Netflix thinks that 90% of the utility of newly originated content has been consumed within 4 years, which suggests that it will have to keep spending to produce new material to keep its audience entertained.
The cash flow can tell us two other things.

Highlighted in yellow: The first is how this this negative cash flow is being financed. Netflix is borrowing the money. Its debt has gone from 35% of revenue to 73% in the last five years.
Highlighted in green: The second is the interesting point that Netflix's capital spending is tiny compared with its revenues.
Perplexing classification
The small capital spending may just be a matter of classification, with Netflix choosing to recognise as operating costs items that other firms might think of as capital in nature. Netflix's capital expenditure includes company planes, offices, and management information systems, but the technology that underpins Netflix's business is shown almost entirely as an operating cost. It is a mystery to us that Netflix is ready to capitalise its production costs for recognition over 4 or more years, as we have seen, but finds little that it considers enduring about its technology spending.
An alternative interpretation is that Netflix relies on other firms to do the majority of its distribution, and relatively little of the technology it uses is its own. The annual report makes no secret of Netflix's use of services from third parties, but is worded to suggest that internal and external provision are of comparable importance.
From Netflix’s 2020 10-K:
We utilize our own communications and computer hardware systems located either in our facilities or in that of a third-party provider. In addition, we utilize third-party “cloud” computing services in connection with our business operations. We also utilize our own and third-party content delivery networks to help us stream TV series and movies in high volume to Netflix members over the internet. Problems faced by us or our third-party “cloud” computing or other network providers, including technological or business-related disruptions, as well as cybersecurity threats and regulatory interference, could adversely impact the experience of our members.
We rely upon Amazon Web Services to operate certain aspects of our service and any disruption of or interference with our use of the Amazon Web Services operation would impact our operations and our business would be adversely impacted. Amazon Web Services (“AWS”) provides a distributed computing infrastructure platform for business operations, or what is commonly referred to as a cloud computing service. We have architected our software and computer systems so as to utilize data processing, storage capabilities and other services provided by AWS. Currently, we run the vast majority of our computing on AWS. Given this, along with the fact that we cannot easily switch our AWS operations to another cloud provider, any disruption of or interference with our use of AWS would impact our operations and our business would be adversely impacted.
While the retail side of Amazon competes with us, we do not believe that Amazon will use the AWS operation in such a manner as to gain competitive advantage against our service, although if it was to do so it could harm our business.
Estimates indicate that Netflix alone accounts for 10-20% of global internet traffic; more, when one looks at the US on busy evenings. We can't help feeling that Netflix's capital expenditure would be higher than it is if any meaningful part of that activity was being performed by Netflix itself.
There's no shame in outsourcing "the vast majority our computing" to Amazon. It's the modern way. Firms can have IP in the software that they have developed without needing to own the hardware it runs on. Zoom is an example of this. Even so, we are led to see Netflix in terms of production assets, films, series, licenses, and so on, rather than in terms of a company with technological assets.
This sense is reinforced by a widely repeated criticism of Netflix: the first 20 minutes of any viewing session are consumed by a search for something worth watching. By comparison, YouTube can provide an endless succession of videos that are hard to tear oneself away from, even though unlike Netflix's they are in many cases made by amateurs with low budgets. Many writers admire Netflix's recommendation machinery but we don't think it works particularly well. It may be that this weakness, and the low capital expenditure, both point to a lack of investing by Netflix in relevant technologies, at least compared with competitors. The capital spending of Alphabet, owner of Google and thereby of YouTube, exceeds the portion of Netflix's operating costs devoted to technology by a factor of 16.
To this extent, we question whether Netflix belongs among the FAANG and FAATMAN groupings as a company underpinned by technology that has any enduring distinction. [4]
What you have to believe
Most equity research seeks to devise a projection of the likely future of the subject company and value whatever results. The approach taken by Pier Analysis is the other way round. It works out what the projection has to be to justify the valuation, and then decides whether the result looks at all plausible.
For their investment to be justified, buyers of the shares need to believe that Netflix can move its margins from the negative territory where they lie in cash terms to something more positive. We present such a projection below.

Highlighted in blue: We imagine that Netflix can instantaneously shift its margin from -15% to +50%.
Highlighted in green: The way this is accomplished is by halving operating costs
Highlighted in yellow: Revenues and cost of sales continue to grow at their current rates for the next five years, and then flatten out.
Highlight in orange: Capital expenditures continue at current rates
This scenario makes mathematical sense, in that it results in Netflix's enterprise cash flow delivering our target return of 10% pa over 15 years, with very little changing apart from the cash margin. But it makes no sense in the real world, since companies aren't in the business of halving their operating costs overnight. And Netflix is clear that it has no interest in stopping what it is doing.
From Netflix’s 2020 10-K:
We have a substantial amount of indebtedness and other obligations, including streaming content obligations. Moreover, we expect to incur substantial additional indebtedness in the future and to incur other obligations, including additional streaming content obligations.
Our ability to make payments on our debt, including our Notes, and our other obligations will depend on our financial and operating performance, which is subject to prevailing economic and competitive conditions and to certain financial, business and other factors beyond our control. In each of the last five years, our cash flows from operating activities have been negative. We may be unable to attain a level of cash flows from operating activities sufficient to permit us to pay the principal, premium, if any, and interest on our debt .. and other obligations, including amounts due under our streaming content obligations.
A more realistic scenario would involve Netflix's margin improving gradually. Compared with our implausible projection, cash flow would be lower in the early years, and likely still negative for several of them. That would have to be offset by cash flows that were even higher than our projection in later years.
None of this is credible. To make sense, one needs a lower rate of return than the 10% pa that Pier Analysis demands, earned over a longer time than the 15 years that Pier Analysis allows. Opportunities that demand bets on the shape of the entertainment industry in 20 or 30 or 50 years’ time are not investments; they are speculations.
What next?
A distinctive feature of Pier Review is that it provides the financial model that underpins each analysis.
If you want to investigate the effect of returns of less than 10% pa, and are willing to wait more than 15 years for the return of your investment, you can use the model to examine the effects of these less demanding requirements. You will see the coloured lines on the graph, which show the projection of cash flow required to justify the valuation, will shift downwards. (The black line on the chart will not move, since it is the result of Netflix’s reported historic performance.)
To receive the spreadsheet
if you have not done so already, subscribe to Pier Review by using the box below
click here to pre-populate a message in your usual email program requesting that the spreadsheet be sent to you
switch to your email program and click Send to despatch the request.
If you find this analysis interesting, you can sign up to have others like it delivered to your inbox several times a month.
Share Pier Review with interested friends.
Notes
[1] Any mention of words equivalent to "this time it's different" should cause investors to should run away rapidly.
[2] Pier Analysis routinely presents cash flows in a direct format, which shows patterns and management choices much more clearly than the indirect presentation found in companies' statutory accounts.
[3] Settings its target return to a high 10% pa and wanting it within a short period of just 15 years characterises the more conservative attitude of Pier Analysis compared with most brokers and, these days, many investors.
[4] For a similar view, see this article by Benedict Evans. His annual presentations on trends in the tech industry are very much worth reading.