
Microsoft
No matter how well a company performs, it is possible to pay too much for it
Unusually ordinary structure
As we saw in recent articles, the shares held by the founders of Facebook have ten times the voting power of the shares available to ordinary mortals. This gives Mark Zuckerberg sufficient voting power to control the company. At Google, half the capitalisation takes the form of a class of share that has no votes at all.
By contrast the shares of Microsoft fall in a single class of common stock, with unremarkable voting rights. It is a curious turn that the firm that once attracted the attentions of the US Department of Justice under antitrust law is now the most straightforward, in terms of governance, among the large and currently fashionable technology companies.
Enterprise value
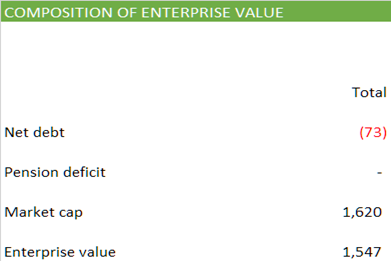
At today's share price of $213.46, these shares in Microsoft have a capitalisation of $1,620b.
To know the value of the business as a whole, we need to combine this market capitalisation of its equity with a number for Microsoft's net debt. The balance sheet shows it with $63b of debt, but much more than that in cash, at $137b, making the net debt figure negative at $73b.
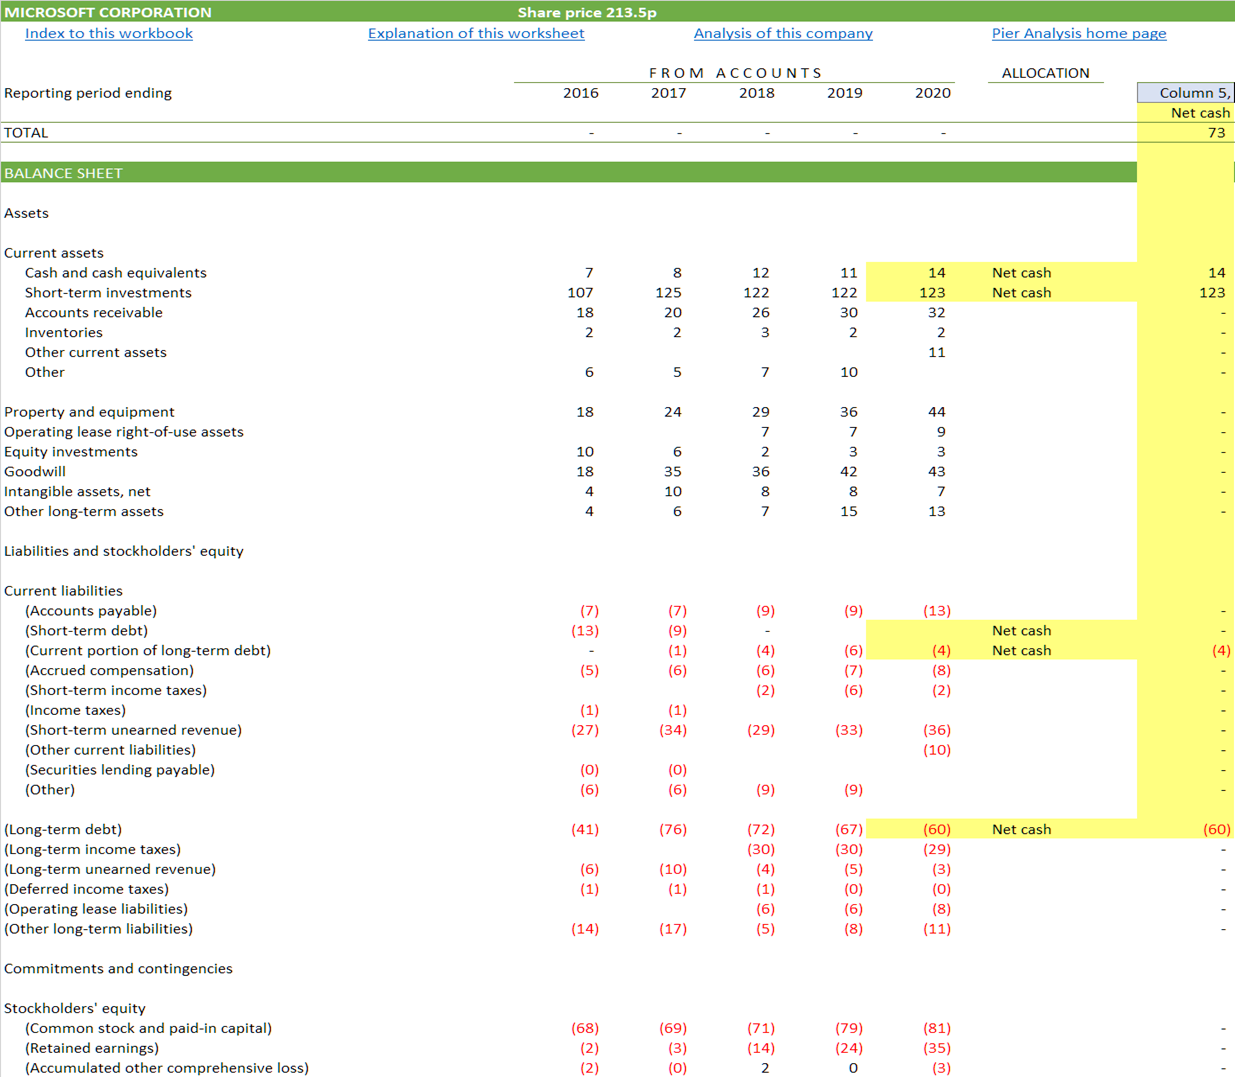
When we combine these figures we find Microsoft has an enterprise value of $1,547b.
Necessary cash flow
Once we know its enterprise value, we can work out what Microsoft needs to achieve to justify that value.
For its value to be justified, we require Microsoft to be able to generate future cash flows that have a present value equal to $1,547b, the just-found enterprise value, when discounted at our chosen rate of return over our chosen time period. Pier Analysis looks for a rate of return of 10% pa, and is willing to wait for 15 years for that return to accumulate. [1].
One way for Microsoft to deliver this value is to generate cash flow around $192b to $223b: this is the violet line on the graph below
Another way is to accept that cash flow may be lower than this range in the early years, say $83b, but make up for that by growing rapidly so that it is significantly higher in the later years, reaching $274b. This is the red line on the graph.
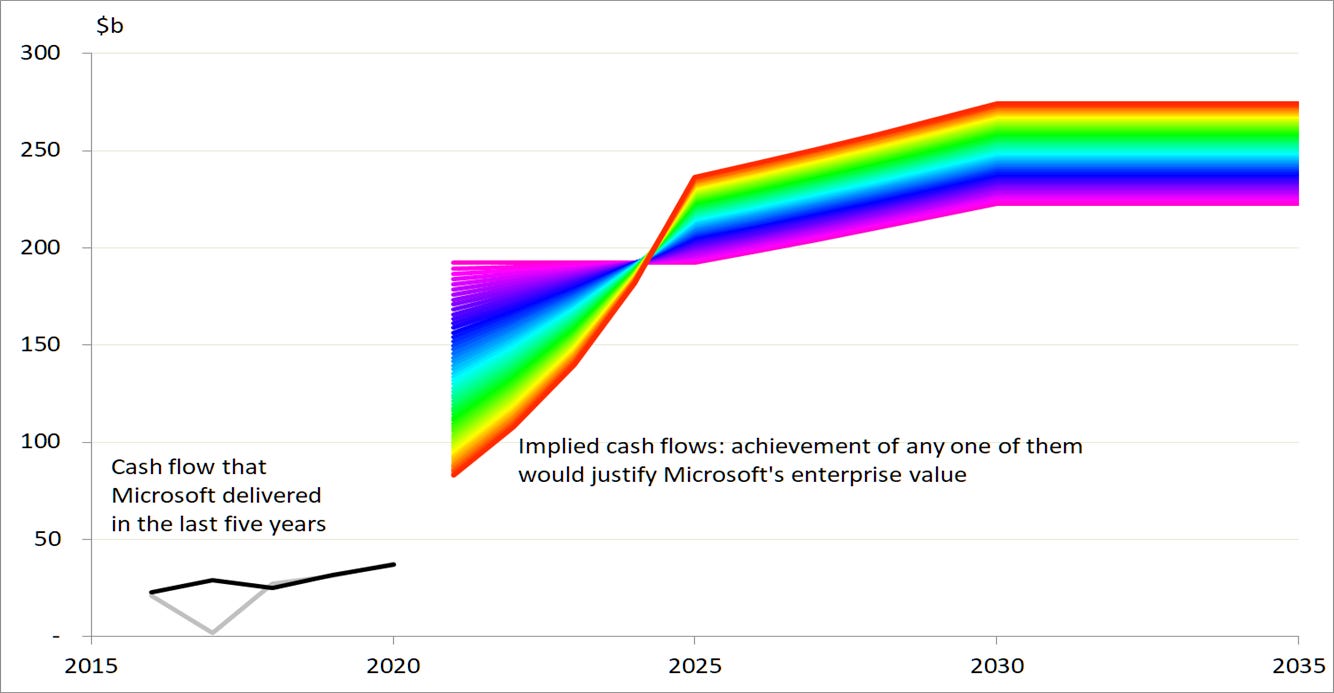
There are countless other possible contours between these two examples, and beyond them. If the cash flow that Microsoft generates in the future follows any of these lines, the benefits of holding a stake in the company (our entitlement to our share of these cash flows, discounted back to today) match the cost of buying that stake.
Actual cash flow
Now that we know what Microsoft needs to achieve to reward us appropriately and return our capital to us, let us have a look at what the company has actually achieved in recent times.
The lines at the left in the graph above show what Microsoft’s enterprise cash flow looked like in the last five years. There is
a grey line, which is what the accounts show
a black line, which reflects what the cash flows would be after some necessarily subjective adjustments aimed at stripping out items that are unlikely to recur in the future.
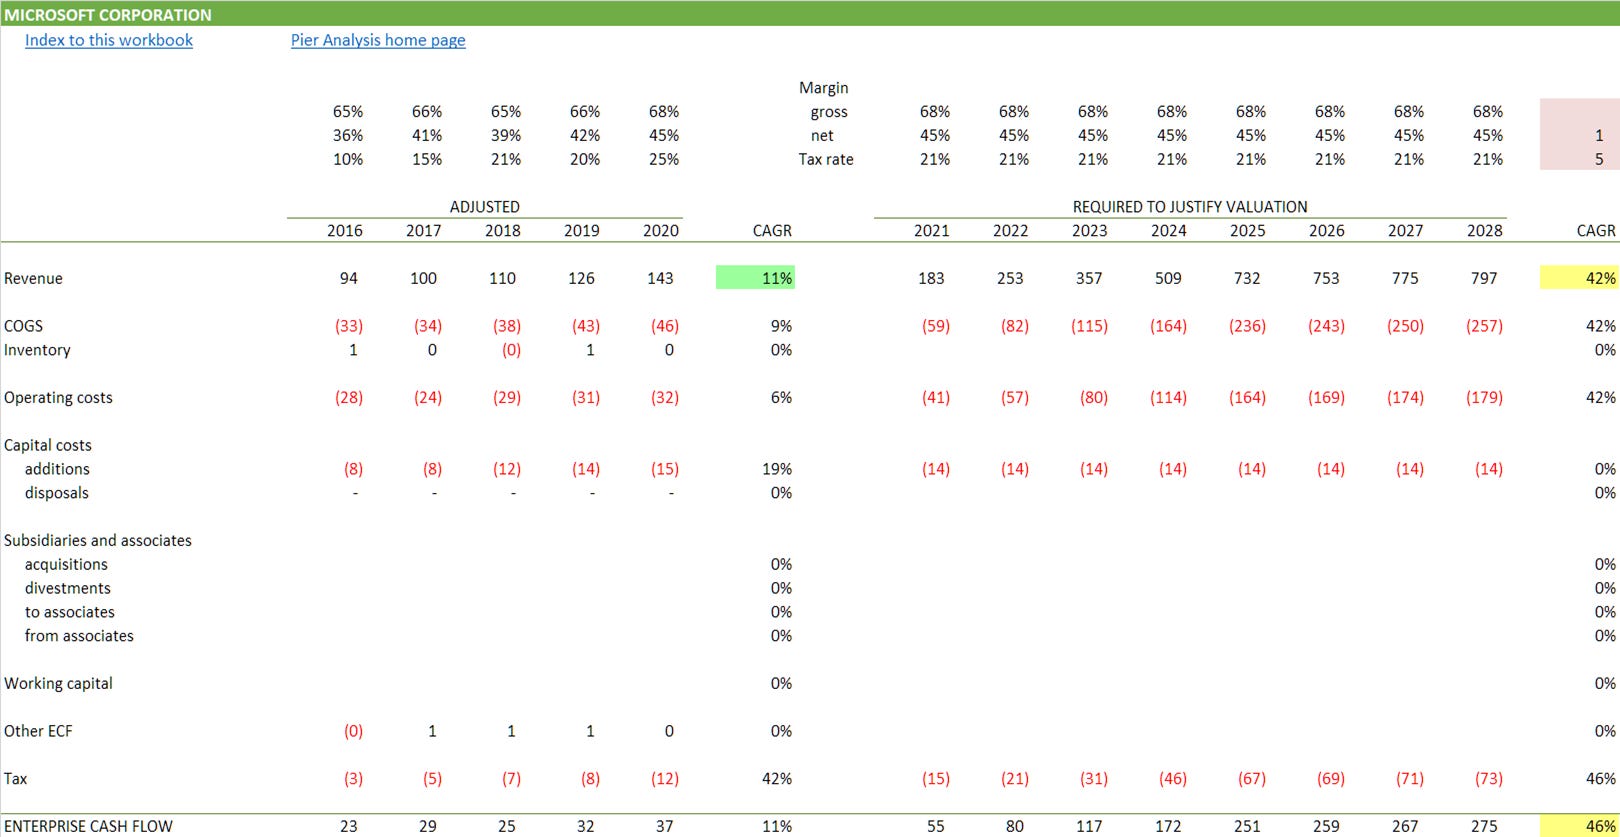
We can see how these profiles are built up, and the adjustments that cause them to diverge, by looking at a representation of Microsoft’s cash flow. [2]
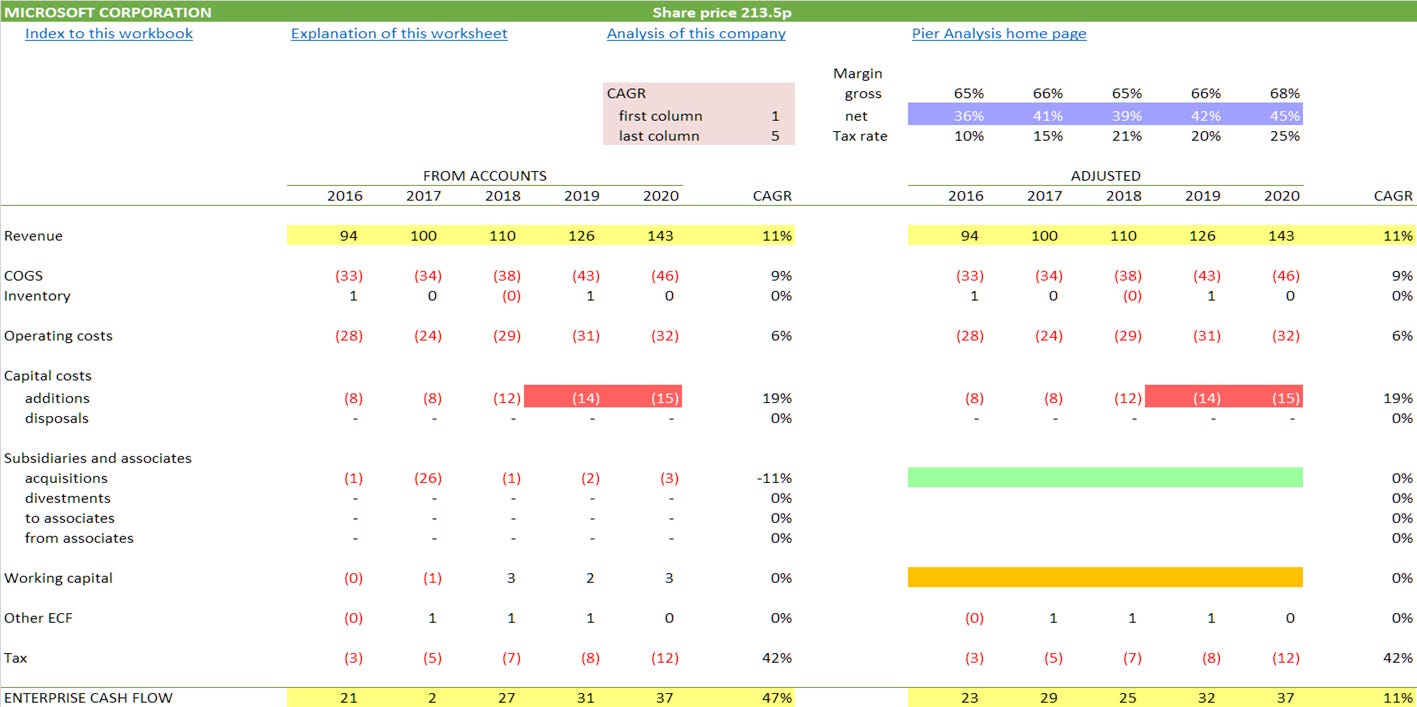
Highlighted in green: The main adjustment is the removal of the costs of acquiring subsidiaries; they have been acquired now, and will contribute to future cash flow without any need for the cost of acquiring them to be repeated.
Highlighted in orange: We have also removed the benefit Microsoft enjoys from working capital. [3] This benefit will be seen every year for as long as Microsoft continues to grow, which it is doing handsomely at the moment, but it cannot be counted on to persist when Microsoft's growth slows, as one day it must.
Highlighted in yellow: What we find after these adjustments is that Microsoft's cash flow rose from $23b to $37b between 2016 and 2020. That increase corresponds to a growth rate of 11% pa. It is the result of revenues also growing at 11% pa..
Highlighted in blue: Unlike some of the companies it is compared with, Microsoft's margins are improving.
Highlighted in red: Against this, Microsoft's capital spending has seen a sharp uptick in recent years. Its increase is the reason why enterprise cash flow is growing no faster than revenues. We saw the same phenomenon with Facebook in our last article, though the companies are spending for different purposes. For Facebook, the goal is to improve ad targeting. For Microsoft, it is to move from processing your documents and spreadsheets on a personal computer owned by you to hosting those documents and spreadsheets on a computer operated by Microsoft.
We will continue to invest in sales, marketing, product support infrastructure, and existing and advanced areas of technology, as well as continue making acquisitions that align with our business strategy. Additions to property and equipment will continue, including new facilities, datacenters, and computer systems for research and development, sales and marketing, support, and administrative staff. We expect capital expenditures to increase in coming years to support growth in our cloud offerings. (Microsoft 10-K, 2020)
Financing
When a company's enterprise cash flow is negative, it is a measure of the funds that need to be found from providers of capital, that is, lenders and investors. When, as here, it is strongly positive, it reflects how much is available to service debt, or distribute to shareholders.
In the financing section of the cash flow, we can see how Microsoft has applied the enterprise cash flow that it has generated.
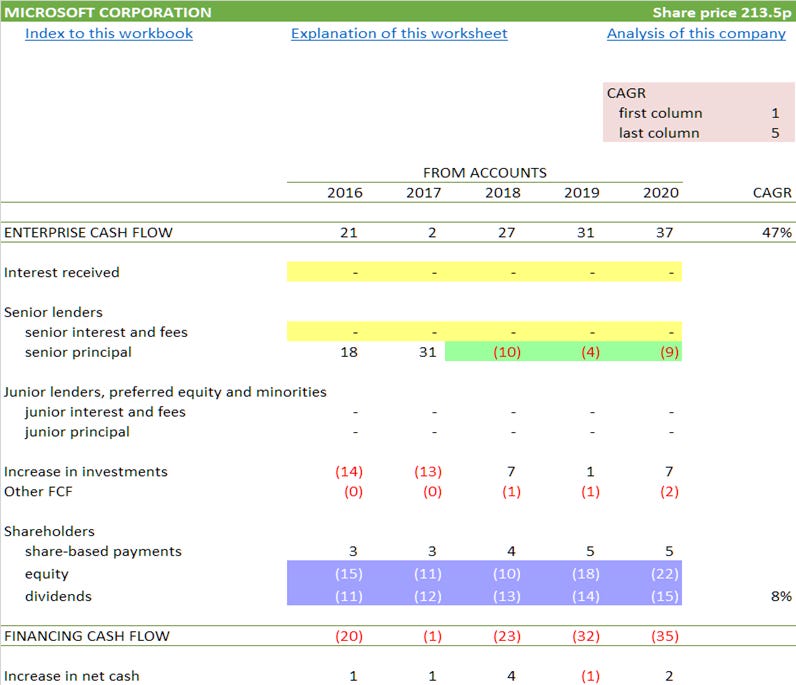
Highlighted in green: Microsoft's debt has been falling from the $86b peak it reached in 2017, because the firm has been steadily paying it off.
Highlighted in yellow: The main financial statements show no interest charge on this debt because they combine it with interest earned on Microsoft's cash hoard and income from its growing pile of investments. These items happen to net off, at least approximately. It would be easy to tease them apart with a little digging into the notes to the accounts.
Highlighted in blue: Of the $96b of enterprise cash flow that the company has generated in the last three years, $91b has been distributed to shareholders. A little less than half has been paid out as dividends, and a bit more than half has taken the form of share buybacks.
Projection
Most equity research seeks to devise a projection of the likely future of the subject company and value whatever results. The approach taken by Pier Analysis is the other way round. It works out what the projection has to be to justify the valuation, and then decides whether the result looks at all plausible. In Microsoft's case, it doesn't.
As we have seen from the graph, the coloured lines showing what's required in the future are much higher than the black and grey lines that represent what has been achieved in the past.
To deliver our target return of 10% pa over a fifteen year period, Microsoft would have to grow its cash flows at 46% pa [4]. At that rate, its cash flow would grow nearly sevenfold by 2025 and its revenues would increase by a factor of more than five.
There is no evidence that Microsoft can grow its cash flows at that rate. We've already seen that its growth rate over the last five years is 11% , though it has to be admitted it is accelerating: 2019's cash flow was 26% higher than the previous year, and 2020's was 18% higher.
Might the growth rate continue on upwards? Of course it could do. The whole tech bubble is based on making bets of this kind, bets which might pay off. Those making them might be right that we are about to see growth on that scale in technology firms as we enter a new era in which life is lived online.
But there is neither enough certainty that this will come to pass, nor any allowance for things go wrong on the way, to consider a bet on Microsoft as anything other than a speculation at current prices.
What next
A distinctive feature of Pier Review is that it provides the financial model that underpins each analysis.
Current technology valuations only make sense to those who are content with a return of less than 10%, and willing to wait more than 15 years for the return of their investment. If you are one of those, you can use the model to examine the effects of these less demanding requirements. You will see the coloured lines on the graph, which show the projection of cash flow required to justify the valuation, will shift downwards. (The black lines on the chart will not move, since they are the result of Microsoft's reported historic performance.)
To receive the spreadsheet
if you have not done so already, subscribe to Pier Review by using the box below
click here to pre-populate a message in your usual email program requesting that the spreadsheet be sent to you
switch to your email program and click Send to despatch the request.
If you find this analysis interesting, you can sign up to have others like it delivered to your inbox several times a month.
Share Pier Review with interested friends.
Notes
[1] The discount rate and time period selected by Pier Analysis are more conservative than is commonly found. This is intentional, to maintain a margin of safety in the analysis.
[2] Pier Analysis routinely presents cash flows in a direct format, which shows patterns and management choices much more clearly than the indirect presentation found in companies' statutory accounts.
[3] Clients pay subscriptions for the right to use software and services. In the accounts, this receipt will be spread over the relevant twelve months, and will only be captured in the reported revenue to the extent that part of it falls in the current year. What is actually received from customers is higher than this reported figure, because Microsoft is able to require that payment for each year is made in advance. The gap between what is recognised as current year revenue and what is received in cash terms is captured in Pier Review's direct cash flow as an inflow of cash from working capital.
[4] Because no business can grow at very high rates for very long, Pier Analysis concentrates the growth in the first third of the projection, after which the cash flows are assumed to flatten off. This approach is what gives the characteristic shape to the coloured lines on the graph showing the future cash flow required to justify the valuation.