
Alphabet / Google
Catching up: Google's revenues are growing four times faster than Apple's
Among the currently fashionable technology stocks, Google gets less press attention than Apple or Tesla. We are at a loss to understand why. Google's revenue has grown at 21.6% pa over the last five years. For Apple, the figure is just 4.3% pa.

And these days, Google has overtaken Apple in having the largest cash pile.
Not always so sought after
Technology stocks have become so sought after that they look expensive when assessed against the intentionally conservative criteria used by Pier Analysis.
It wasn't always so. Some years ago, Google produced results that fell short of what Wall Street had been expecting. Up to that point, its revenues and cash flows had been growing at around 50% pa. Suddenly, growth slowed, to about 30% pa. That's fantastic for most companies, but for fast-growing Google, it was a let down. The share price dropped significantly.
Enter the techniques described regularly here in Pier Review. They showed that the depressed valuation made sense [1] to anyone who could convince themselves that Google could grow its cash flow by at least 8% pa for just five years. After that, the growth could slow, and in year 16, the company could disappear altogether [2].
Google may have been slowing down, but it stretched credulity that it would decelerate to that extent. This was a business that had a near monopoly in the storage of the totality of human knowledge. Anyone who bought the shares then, as the Pier Analysis team did, has seen them grow several times over. For those based in the UK, the Brexit-induced fall in sterling has amplified the gain when measured in pounds, to something approaching ten fold.
Enterprise value
That was then, before valuations went crazy. What does Google look like now?
For a start, it is no longer called Google. Though it still trades under ticker symbols GOOG and GOOGL, the business is now called Alphabet, and its activities extend beyond the well-known search engines into self-driving cars, artificial intelligence and myriad others.
There are three classes of share, A, B and C.
Our board of directors has authorized three classes of stock, Class A and Class B common stock, and Class C capital stock. The rights of the holders of each class of our common and capital stock are identical, except with respect to voting. Each share of Class A common stock is entitled to one vote per share. Each share of Class B common stock is entitled to 10 votes per share. Class C capital stock has no voting rights, except as required by applicable law. Shares of Class B common stock may be converted at any time at the option of the stockholder and automatically convert upon sale or transfer to Class A common stock.
Whenever there are multiple share classes, Pier Analysis works out the market capitalisation from first principles, because the online data providers can't be depended on to do it correctly. The class B shares are not quoted; they are held by the founders. Nevertheless, since they have the same economic interest in the business as do the class A shares, they need counting when working out the value of the company. The websites of Bloomberg and Nasdaq make this adjustment. The FT and the Wall Street journal don't. Yahoo makes it for the A shares but not the C shares.
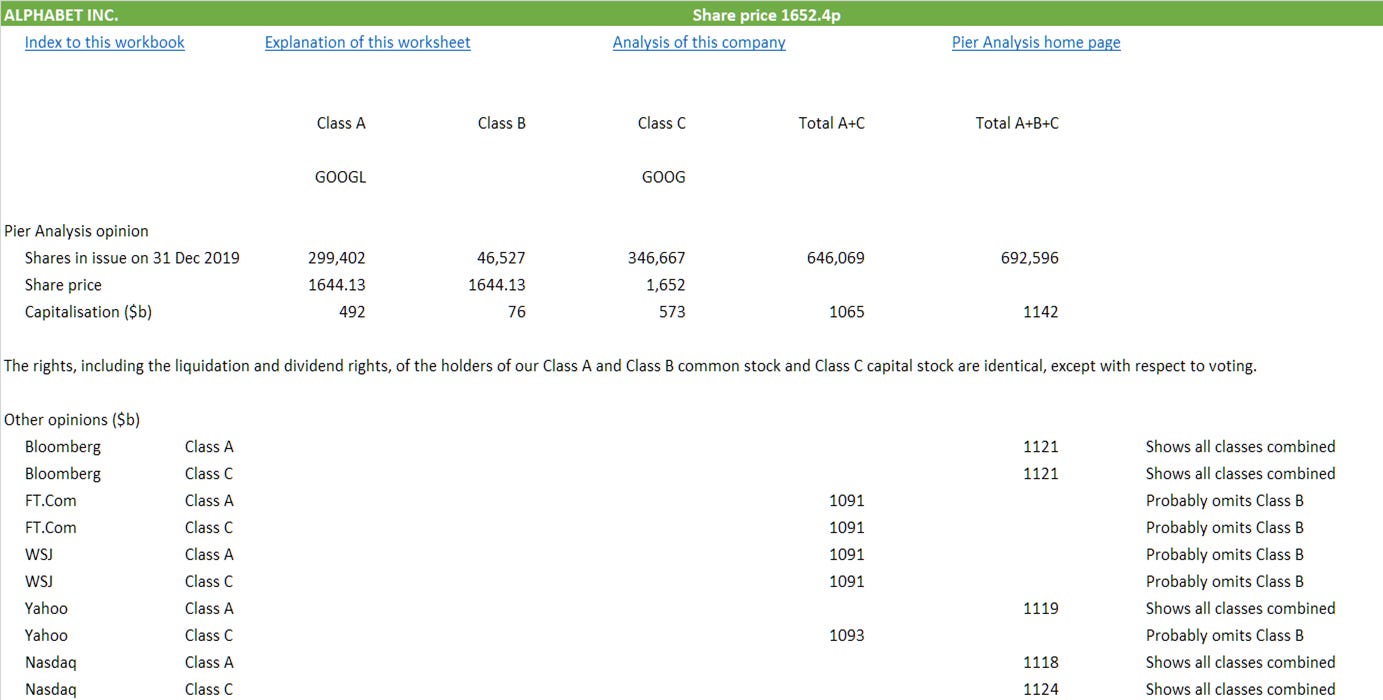
Doing this properly brings us to $1,142b as the value for the overall capitalisation of Alphabet. This is the amount shareholders have at stake in the business. To derive an enterprise value, covering the business as a whole, we need to combine this figure with whatever Alphabet owes to its lenders.
Apple has attracted much publicity for the pile of cash that it is sitting on, but the pile has depleted, and Apple's debt has risen, as it has spent not far off a quarter of a trillion dollars buying back its own shares. Alphabet has bought back shares to a much smaller degree and for a shorter time. The result is that it is Alphabet, not Apple, that has the larger net cash position these days, $115b versus $98b.
Net cash of $115b is net debt of minus $115b, making an enterprise value of $1,026b.

Necessary cash flow
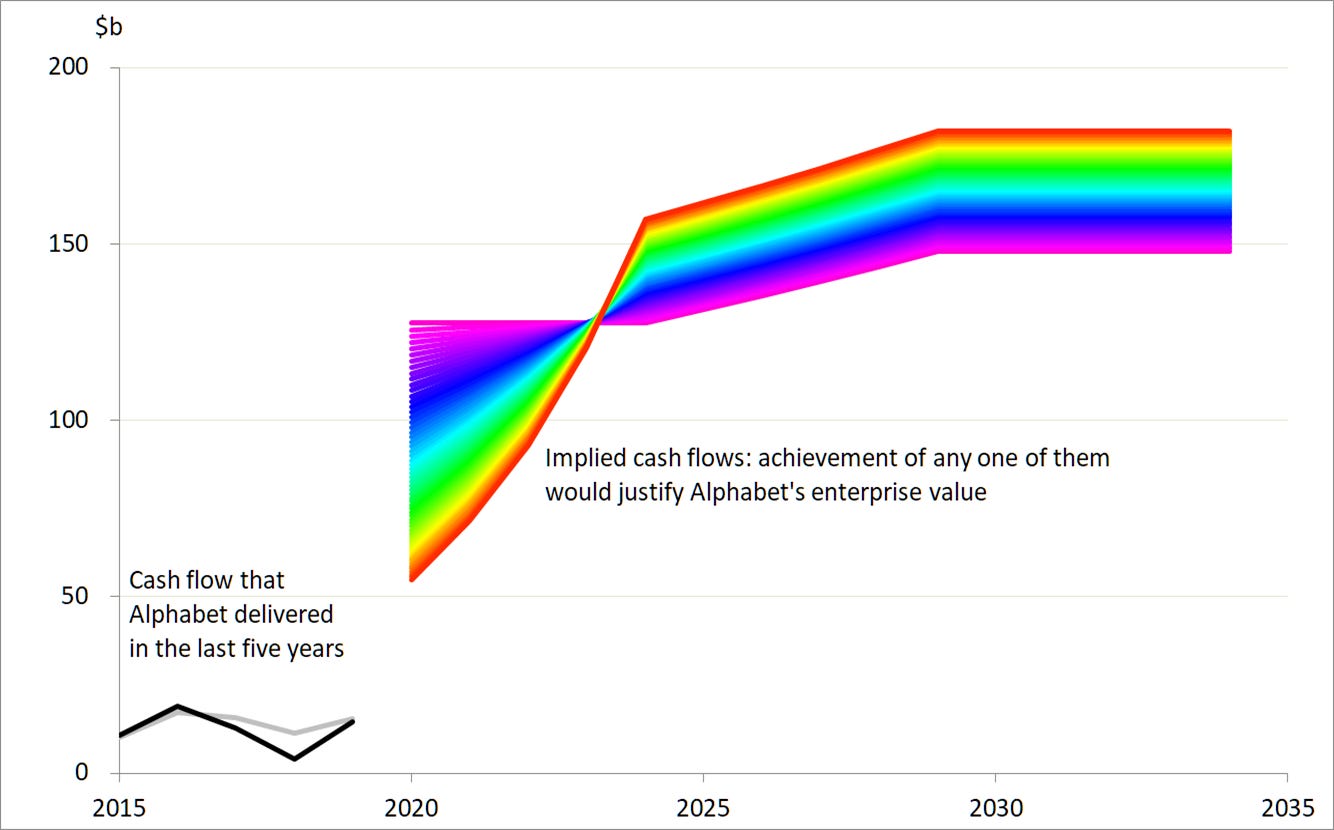
Once we know the enterprise value, we can work out how much cash flow Alphabet needs to generate in order to justify this valuation. [1]
Among the range of trajectories that would do the job is one that starts around $128b and rises gently to $148b: this is the violet line on the graph below.
Another way is to deliver a cash flow that is lower than this range in the early years, say $55b, but makes up for that by growing rapidly so that it is significantly higher in the later years, reaching $182b. This is the red line on the graph.
And there are infinitely many contours between these two examples, and beyond them. Any one of the cash flow profiles shown would put Alphabet in the position to return our investment within 15 years and give us a 10% return while we wait for it.
Actual cash flow
Now that we know what Alphabet needs to achieve to reward us appropriately and return our capital to us, we can look to see what the company has actually managed. The lines at the left in the graph above show what Alphabet’s enterprise cash flow looked like in the last five years. There is
a grey line, which is what the accounts show
a black line, which reflects what the cash flows would be after some necessarily subjective adjustments aimed at stripping out items that are unlikely to recur in the future.
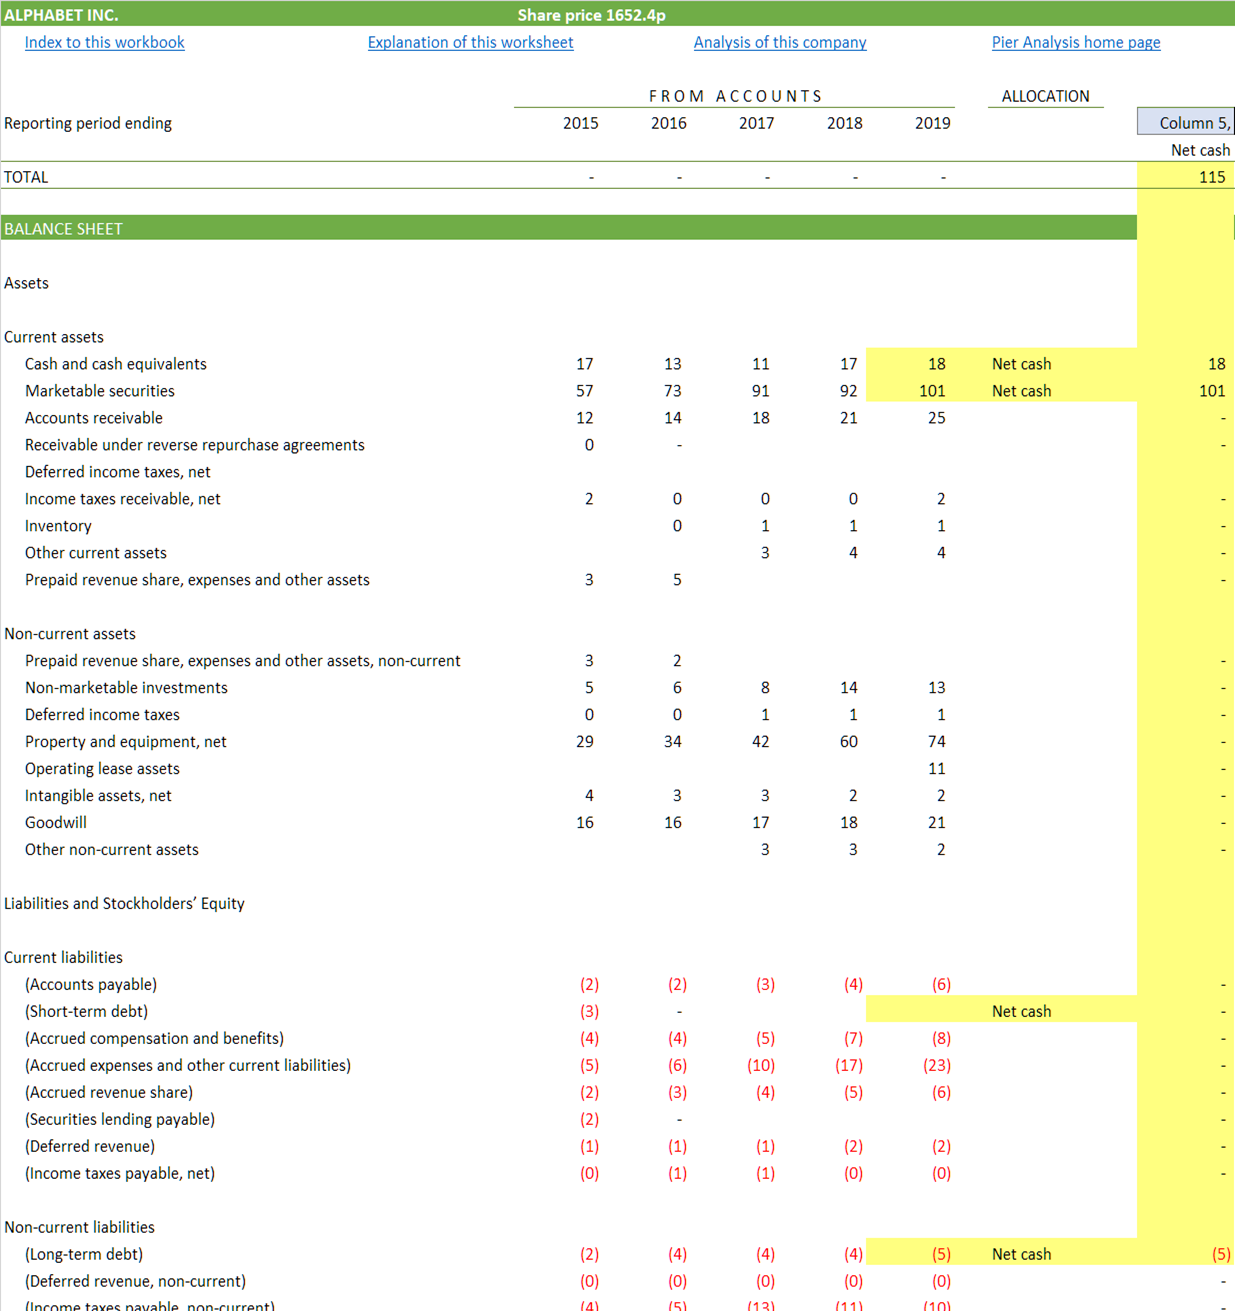
The main such adjustment is the removal of the costs of acquiring subsidiaries; they have been acquired now, and will contribute to future cash flow without the cost of doing so needing to be repeated. These are the items highlighted in green in the cash flow extract below.
In the opposite direction, we have eliminated the proceeds that Alphabet gained from divesting unwanted subsidiaries. These are the items highlighted in red.
We have also eliminated the working capital benefit that Alphabet has enjoyed in recent years, we judge it to be transient. It is highlighted in yellow.
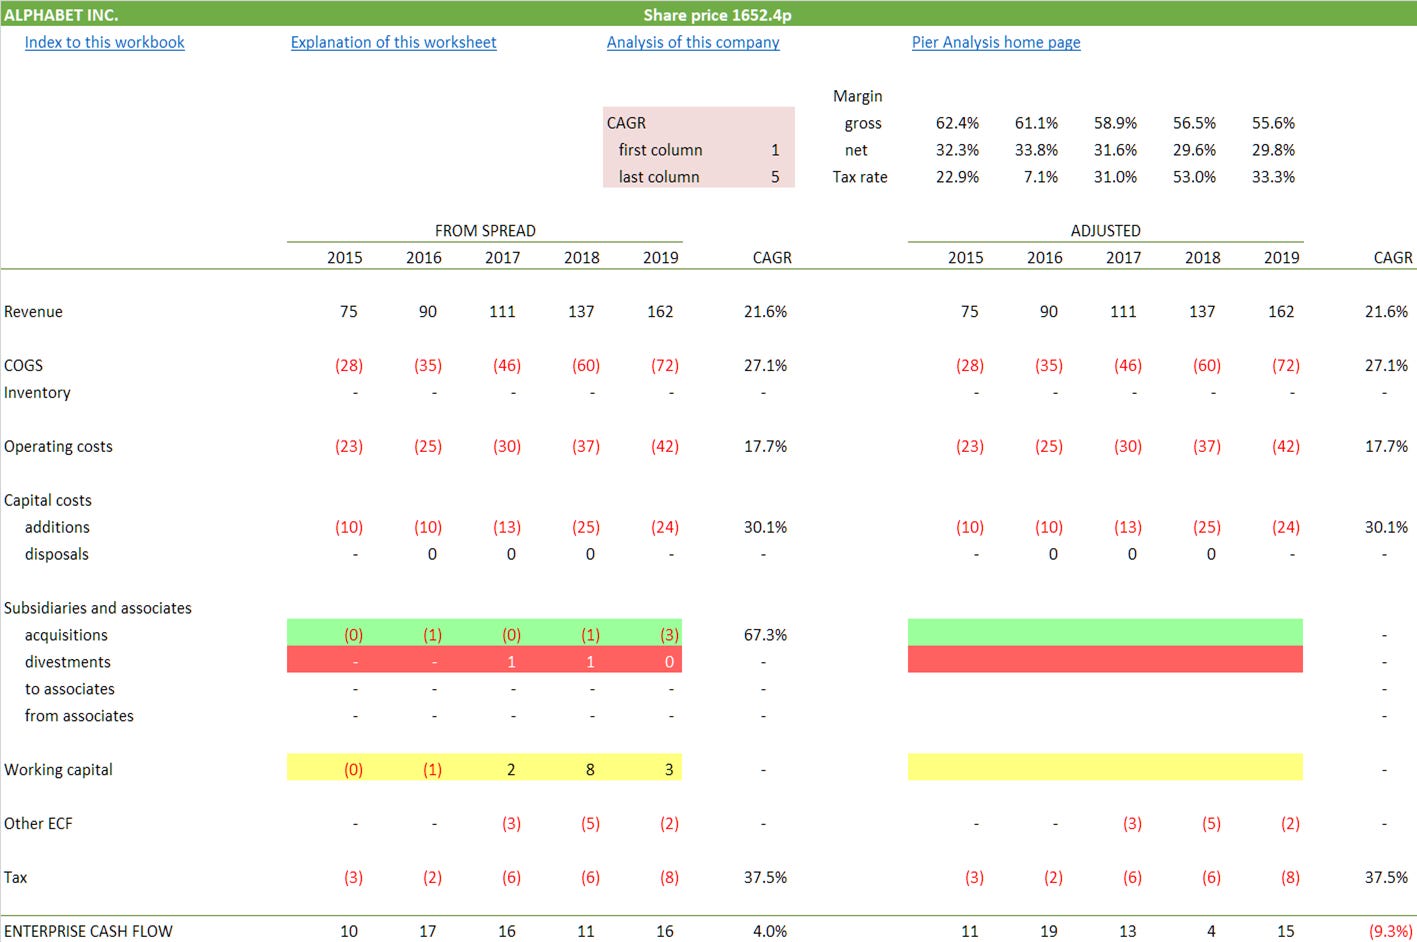
What we find is that Alphabet's cash flow touched $19b in 2016, but has been less than that in recent years, in spite of revenue coming close to doubling during the period. The cash has been consumed by a drop in margins and a striking spurt in capital expenditure.

Alphabet's capital spending is now twice the size of Apple's, even though Apple's revenue is 60% larger. It consumes 15% of Alphabet's turnover compared with 4% of Apple's.
The annual report gives no clue what it is being spent on. The Financial Times thinks the answer is real estate, in the form of new offices, and the computing infrastructure needed to support machine learning and artificial intelligence.
The bull case for Alphabet is that this investment is being poured into new products that will use artificial intelligence to change our lives in ways that we are not even beginning to imagine, and will generate extraordinary amounts of value for Alphabet to capture. That may turn out to be true, but betting on it is a speculation rather than an investment with any grounding in judicious projections of cash flow.
To justify the current share price, one has to believe that Alphabet's cash flow will break out of the $10b - 20b range where it has lingered for the last five years, and head towards something north of $100b. That would need sales to start growing at twice the rate they have been doing.
None of this is to say anything adverse about Alphabet. It is a fine company, one whose valuation has been bid up to a point that makes sense only to those with animated opinions about the company's prospects.
What next?
A distinctive feature of Pier Review is that it provides the financial model that underpins each analysis.
If you are content with a return less than 10%, or willing to wait more than 15 years for the return of your investment, you can impose less demanding requirements. You will see the coloured lines, which show the projection of cash flow required to justify the valuation, will shift downwards. (The black lines on the chart will not move, since they are the result of Alphabet's reported historic performance.)
To receive the spreadsheet
if you have not done so already, subscribe to Pier Review by using the box below
click here to pre-populate a message in your usual email program requesting that the spreadsheet be sent to you
switch to your email program and click Send to despatch the request.
If you find this analysis interesting, you can sign up to have others like it delivered to your inbox several times a month.
Share Pier Review with interested friends.
Notes
[1] For its valuation to make sense or to be justified, we mean we require Alphabet to be able to generate future cash flows that have a present value equal to $1,026b, Alphabet's enterprise value, when discounted at 10% pa over 15 years.
[2] Pier Analysis makes the assumption that companies will generate useful cash for only 15 years. This assumption is intentionally conservative, aimed at blessing the evaluation with a large margin of safety. But it is not as conservative as it might sound. The average company listed on a stock exchange lasts just 40 years before disappearing through bankruptcy or acquisition. Some think the life is shrinking and is already lower than 40 years. And the average company will be half way through that 40 year life cycle, so only has 20 years or so to go. Certainly, this approach is very different from broking analysts, who are taught to treat companies as if they are immortal.