
Fashionable technology companies are priced at levels consistent with growth rates characteristic of startups. Some, like Tesla, don't generate any cash flow to speak of. Others, such as Apple, produce cash flow but are not growing. Neither of these drawbacks afflict Facebook. It turns 21% of its revenue into free cash flow that is rising at over 40% pa.
Enterprise value
Facebook offers two classes of shares.
Our certificate of incorporation authorizes the issuance of Class A common stock and Class B common stock.
Holders of our Class A common stock and Class B common stock are entitled to dividends …
The holder of each share of Class A common stock is entitled to one vote, while the holder of each share of Class B common stock is entitled to ten votes.
Shares of our Class B common stock are convertible into an equivalent number of shares of our Class A common stock and generally convert into shares of our Class A common stock upon transfer.
As of December 31, 2019, there were 2407 million shares and 445 million shares of Class A common stock and Class B common stock, respectively, issued and outstanding.
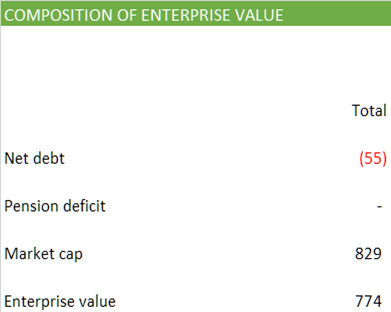
At today's share price of $291.12, these 2852 million shares have a value of $829b.
Facebook has never paid a dividend. The cash flow that it is now generating is piling up as investments in marketable securities and deposits in its bank accounts, to the tune of $55b.
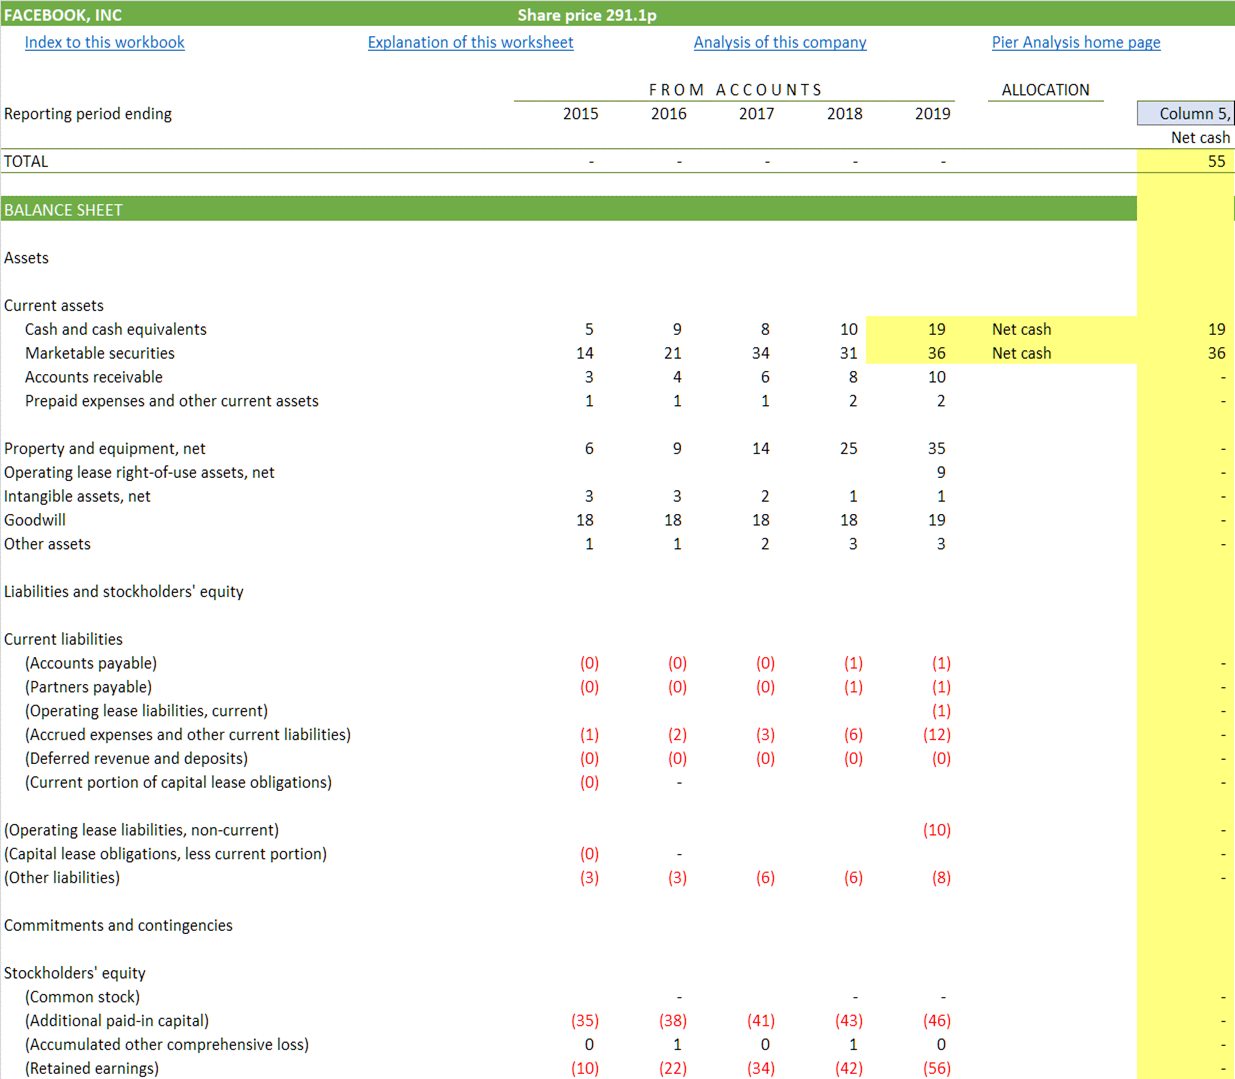
Net cash of $55b is net debt of minus $55b, making an enterprise value of $774b.
Necessary cash flow
Once we know its enterprise value, we can work out how large are the cash flows Facebook needs to generate to justify that value [1].
One way is to deliver cash flows around $96b to $112b: this is the violet line on the graph below
Another way is to accept a cash flow that is lower than this range in the early years, say $41b, but makes up for that by growing rapidly so that it is significantly higher in the later years, reaching $137b. This is the red line on the graph.
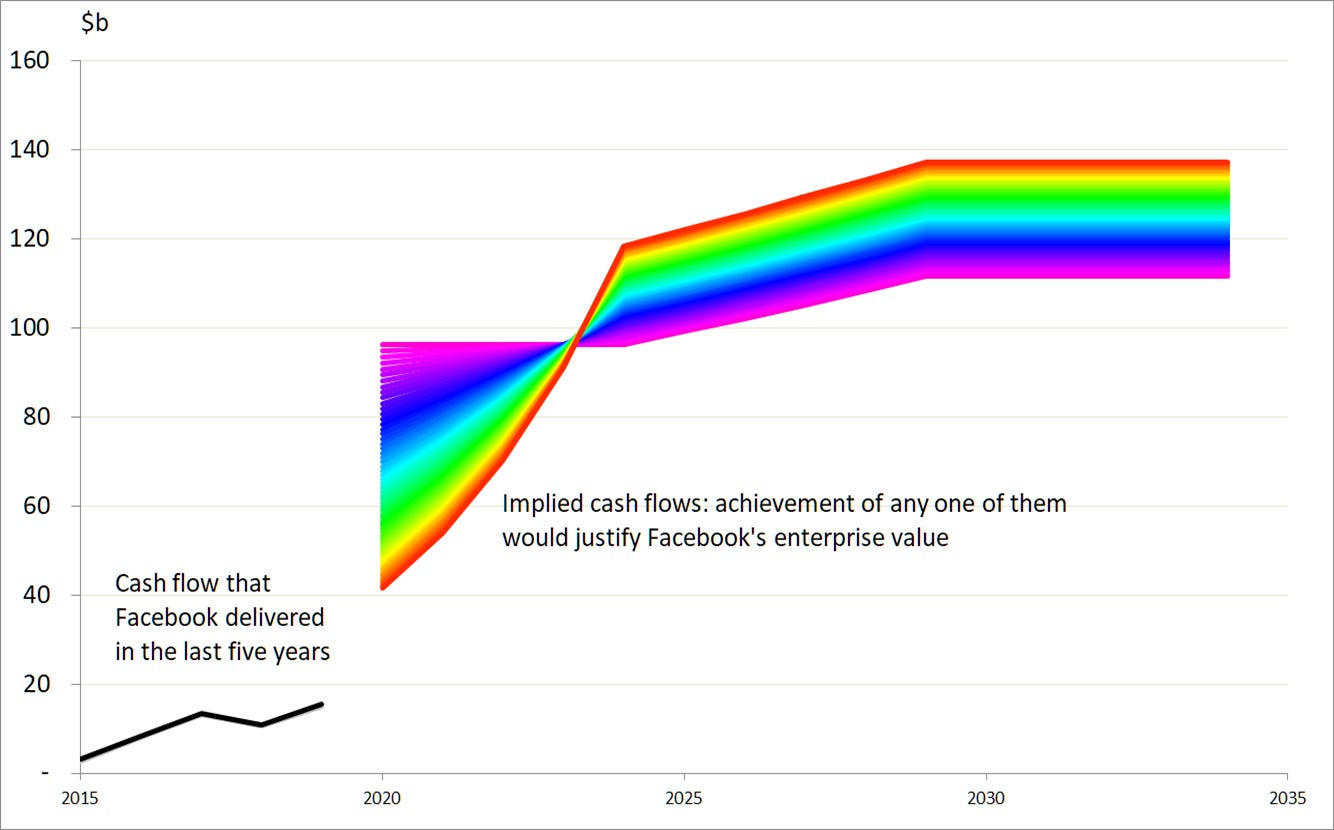
And there are infinitely many contours between these two examples, and beyond them. If the cash flows that Facebook generates in the future follow any of these lines, the benefits of holding a stake in the company (our entitlement to our share of these cash flows, discounted back to today) match the cost of buying that stake.
Actual cash flow
Now that we know what Facebook needs to achieve to reward us appropriately and return our capital to us, we can look to see what the company has actually managed. The line at the left in the graph above shows what Facebook’s enterprise cash flow looked like in the last five years.
What we find is that Facebook's cash flow rose from $3b to $16b between 2015 and 2019. That five fold increase corresponds to a growth rate of 41% pa. It is the result of revenues also growing at 41% pa.
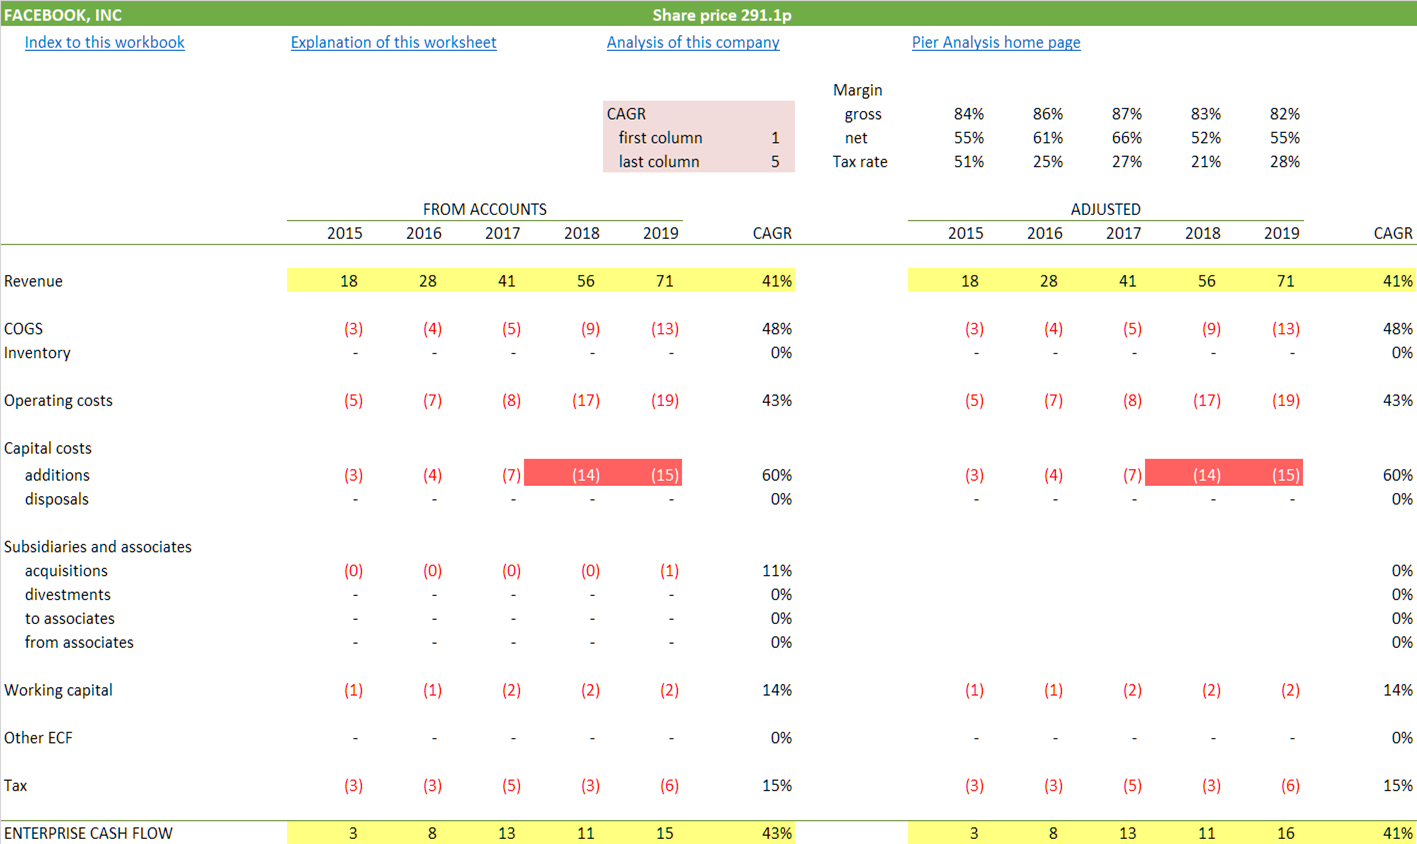
That the revenue growth rate and the cash flow growth rate coincide is unusual. Normally revenue growing at 41% pa would result in enterprise cash flow growing rather faster because only some of the cash operating costs, and none of the capital costs, grow in lock-step with sales. But Facebook's capital expenditure is by no means static. 2018 saw it undergo a striking leap. We saw in our last newsletter that Apple's capital expenditure is now running at 4% pa and Alphabet's is 15%. For Facebook the figure moved from 16% to 21%. It seems to be devoting the cash to systems driven by artificial intelligence that can be yet more effective than now in serving up ads that the reader will find relevant.
From the 10-K:
Cash used in investing activities during 2019 mostly resulted from $15.10 billion of net purchases of property and equipment as we continued to invest in data centers, servers, office buildings, and network infrastructure
From a report of CFO David Wehner in a quarterly earnings call:
"There's a lot of compute that goes behind things like feed ranking and ads ranking. We think there's good ROI [return on investment] to putting more servers behind things like choosing the right ad for the right impression opportunity that we have."
That's not all, though. Wehner said that "a lot of our growth is coming from markets in Asia -- our top growth countries were India, Indonesia, and the Philippines." (Facebook reported a 37.6% year-over-year increase in advertising revenue from the Asia-Pacific region last quarter, which was faster than overall advertising revenue growth of 33.5%.)
"So we're building the capacity to serve that Asian peak and those users are at a lower ARPU [average revenue per user]," Wehner said. "So that impacts the overall capital intensity."
When Wehner refers to capital intensity, he's talking about capex as a percentage of revenue; when that number is higher, so, too, is capital intensity. If ARPU in these growth markets is lower, then the amount of capital that Facebook has to spend, on average, to serve those users is higher than in regions where ARPU is higher.
Financing
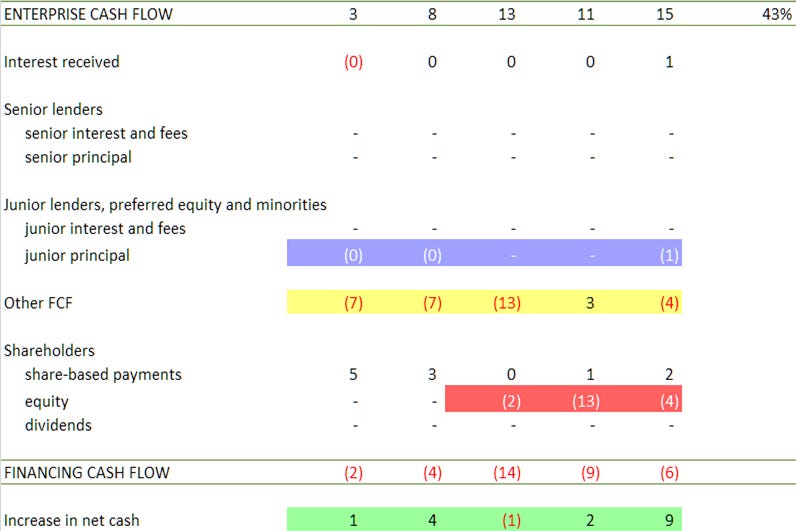
Facebook has no debt, so it pays no interest and needs to make no repayments. The closest it comes to any kind of debt is making payments on finance leases [highlighted in blue below].
While it has yet to pay a dividend, it has applied around half of its cash flow in the last three years to share buybacks [highlighted in red]. It authorised an extension of that programme in January.
What is not being spent on share buybacks is being invested in marketable securities [shown within Other FCF, for Other financing cash flow, and highlighted in yellow] and piling up in the bank [highlighted in green].
Projection
Most equity research seeks to devise a projection of the likely future of the subject company and value whatever results. The approach taken by Pier Analysis is the other way round. It works out what the projection has to be to justify the valuation, and then decides whether the result looks at all plausible. Quite often it doesn't.
We can make a just about plausible case for the current valuation of Facebook. The argument goes
To justify the current share price, one has to believe that Facebook can grow its cash flow at 52% pa. This is highlighted in yellow in the projection below [2]
Facebook can deliver cash flow growing at that rate if it can see to it that its revenues grow at the slightly lower rate of 41% pa, highlighted blue
This 41% pa is much the same as the revenue growth rate that Facebook has already demonstrated, highlighted green
For this reasoning to hold, one has to believe that
Facebook can keep up this historic revenue growth rate: most competitors, though they once matched it, find themselves slowing considerably
margins, highlighted in red, will stay as they are: it is more usual for them to sag over time
there will be no need for capital expenditure, also highlighted in red, to rise from current levels to support the increasing revenue: not quite as implausible as it might seem, because we have seen that Facebook's investment is already at a very high level that may not be permanent.

We can't quite bring ourselves to accept these preconditions. Still less are we willing to bet large parts of our wealth on the notion implied by these growth rates that Facebook can multiply its cash flow nearly tenfold in a decade, from the teens to the hundreds of billions of dollars. But the fact that we can see a story that has even a sniff of plausibility shows that Facebook is closer to justifying its current valuation, against Pier Analysis's intentionally severe criteria, than are any of the other technology stocks that we have covered.
That's a long winded way of saying that Facebook is cheaper, relative to its high growth rate, than those competitors. The reasons for that are likely simple: it's a controversial company that attracts none of the love of Apple, and its head is more visible above the parapet of political risk and possible regulation.
What’s next
A distinctive feature of Pier Review is that it provides the financial model that underpins each analysis.
If you are content with a return less than 10%, or willing to wait more than 15 years for the return of your investment, you can impose less demanding requirements. You will see the coloured lines, which show the projection of cash flow required to justify the valuation, will shift downwards. (The black lines on the chart will not move, since they are the result of Facebook's reported historic performance.)
To receive the spreadsheet
if you have not done so already, subscribe to Pier Review by using the box below
click here to pre-populate a message in your usual email program requesting that the spreadsheet be sent to you
switch to your email program and click Send to despatch the request.
If you find this analysis interesting, you can sign up to have others like it delivered to your inbox several times a week.
Share Pier Review with interested friends.
Notes
[1] For its valuation to make sense or to be justified, we mean we require Facebook to be able to generate future cash flows that have a present value equal to $774b, Facebook's enterprise value, when discounted at 10% pa over 15 years. Intentionally, the 10%pa is higher than many people would use and the 15 years is considerably shorter.
[2] The cash flow profile shown in the projections shares with the coloured lines shown on the graph that it delivers the $774b enterprise value when discounted at 10% pa over 15 years. It grows even faster than any of those so that it can connect with, and thereby be a sensible extrapolation of, the historic cash flows.
