


Diversified Energy
Shareholders' cash has been spent accumulating reserves. How large are they?
In this article we examine Diversified Energy Company PLC, as a good few readers have expressed interest in it. Until very recently it went by the name Diversified Gas and Oil PLC.
Though quoted on the London Stock Exchange, Diversified Energy is based in Birmingham, Alabama, and its activities are confined to the eastern United States. The company functions differently from the larger oil companies such as Shell and BP that we covered recently. It pursues no upstream exploration and has no downstream refining or petrochemical activities. Its approach is much simpler. It buys existing assets that their current owners have developed and tired of, mainly in gas, mainly in the Appalachian region of the US1 , and seeks to operate them as efficiently as it can for what remains of their life.
Business Model
Why we are different
Our business model and the corporate culture we cultivate is unique among the natural gas and oil industry in that we do not engage in capital-intensive drilling and development. Rather, our stewardship model focuses on acquiring existing long-life, low-decline producing wells and, at times, their associated midstream assets, and then efficiently managing the assets to improve or restore production, reduce unit operating costs, and generate consistent Free Cash Flow before safely and permanently retiring those assets at the end of their useful lives.
The results have been spectacular. Between 2016 and 2020 the firm’s revenues have grown almost twenty fold and its dividends have grown a hundred fold.
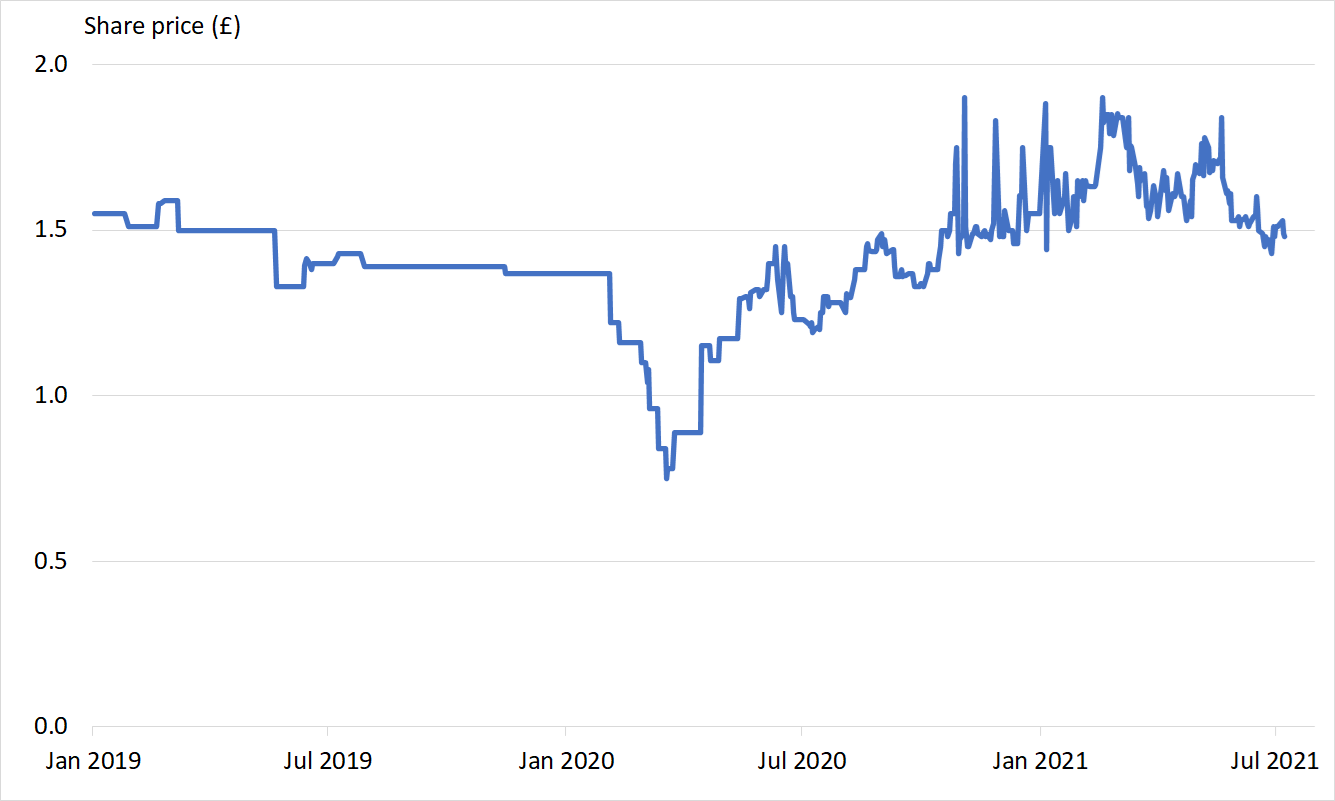
The business model may be different, but Diversified Energy’s share price has encountered the same fate as other oil and gas companies. When the significance of the coronavirus became apparent, the share price shrank to half of what it was. Unlike the legacy oil companies, however, it has more than recovered from those lows, though the price has sagged in recent weeks.
Click on this and subsequent exhibits to enlarge them if they are too small to read.
Enterprise value
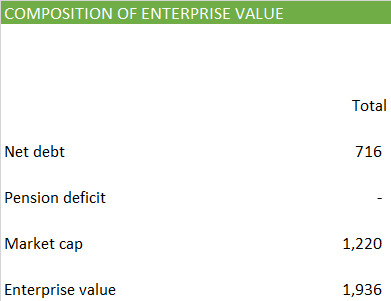
Diversified Energy’s balance sheet shows that it has
Highlighted in red: debt of $717m
Highlighted in yellow: cash of $1m
Highlighted in orange: As a result, net debt of $716m

These items indicate how much it owes to its lenders. Where they exist we also take into account pension obligations, since we consider obligations to former employees as debt like any other, but unlike legacy oil companies Diversified Energy has none of those.
We use Diversified Energy’s market capitalisation as a measure of how much its investors believe they have at stake in the business. It stands at £935m, equivalent to $1,220m
When we put these things together, we see the business has an enterprise value of $1,936m.
Required cash flow
Given this enterprise value, it’s a matter of simple maths to work out how rapidly Diversified Energy needs to generate cash in the coming years to deliver a return of and on these amounts to lenders and shareholders. There are countless ways Diversified Energy could accomplish it.
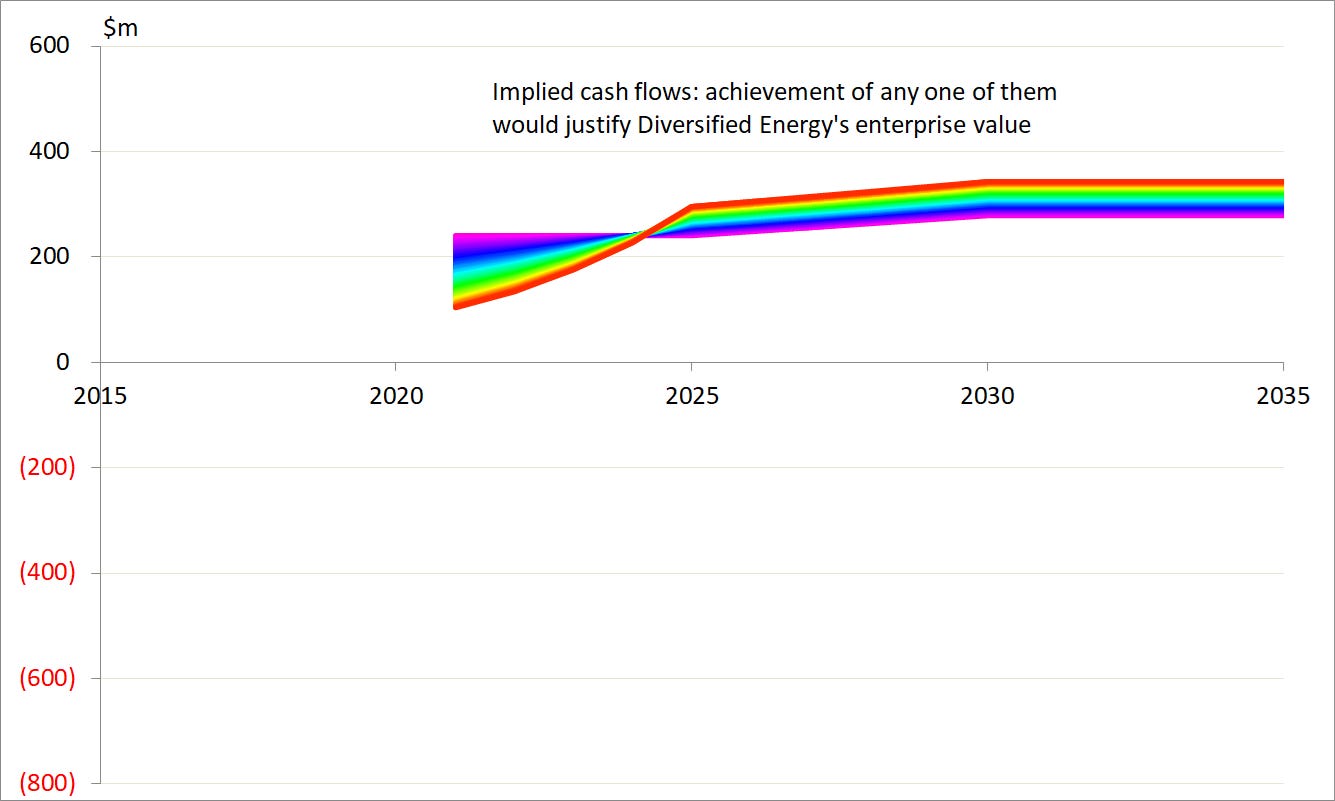
Among the hundreds of cash flow profiles that we show in the chart, there are ones
with a violet hue, which start at $241m and rise only a little over time to $279m
at the red end of the spectrum, which start low at $104m, but offset that by rising quickly so that they eventually get as high as $343m.2
Actual cash flow
Now that we have some idea of what Diversified Energy’s cash flows need to look like if it is to be an attractive investment, let us look at the recent past to see what it actually delivered. Like nearly every other large company, Diversified Energy presents its cash flows using a layout that is incomprehensible to most people. It is much easier to understand what is going on if they are represented in a simple way that starts with revenue, and subtracts successive categories of costs until we find what’s left for the providers of finance, that is lenders and investors.
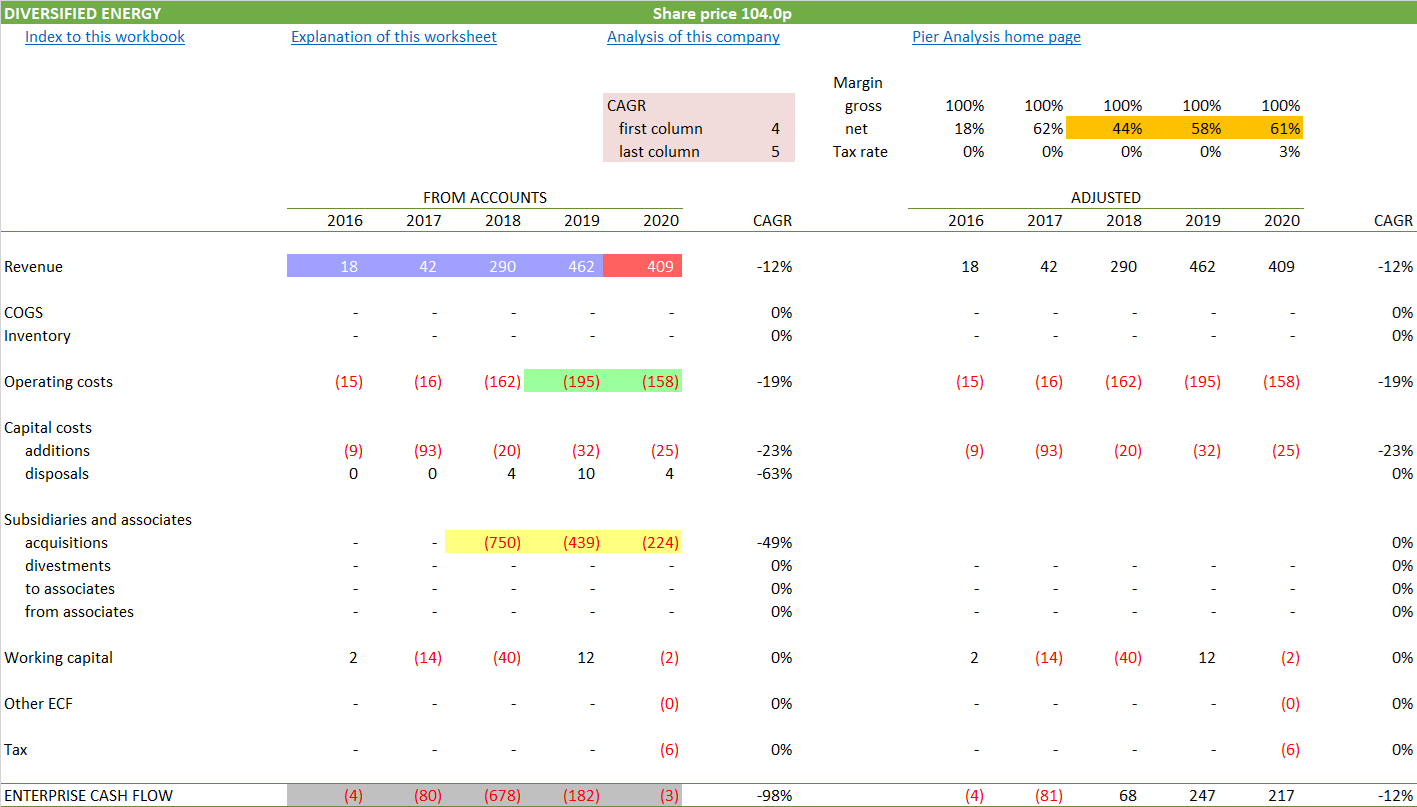
Highlighted in blue: Between 2016 and 2019, the firm’s revenue shows the twenty fold growth already mentioned.
Highlighted in red: Like nearly every other company in the oil and gas business, Diversified Energy’s revenue has dipped sharply in the pandemic. At 12%, the drop is much less than we saw for Shell and BP. One’s first instinct is to attribute this to Diversified Energy ’s hedging programme. On further thought it is reasonable to ask what it is about this company that leaves it more able to control the sales price of its product than are the larger companies, which are better funded and equipped with much larger risk management departments. It’s likely that Diversified Energy ’s focus on gas is helpful here. The price of gas has moved much less than the price of oil.
Highlighted in green: Diversified Energy managed to reduce its operating costs by 19%. As a result, its operating cash flow was within 7% of its pre-Covid level.
Highlighted in orange: This cost control was effective enough to cause cash operating margins to increase, quite an achievement at the same time as Covid was lacerating revenues.
Highlighted in yellow: Diversified Energy has spent $1.4b on acquisitions in the last 3 years.
Highlighted in grey: As a result, Diversified Energy’s enterprise cash flow has been negative throughout the last five years.
Underlying cash flow
Though the way we present them is different from the one the company follows in its financial statements, the cash flows just shown are merely a rearrangement of the published numbers and are entirely consistent with them. To the right of them, we produce an alternative version that is quite different. We remove the acquisition costs, to see what the cash flows look like without them.
Our grounds for doing so are that we want to strip out items that can’t be expected to recur, in order to uncover the company’s underlying ability to generate cash. The acquisition costs so dominate the Diversified Energy’s recent activity that we need to interpret their removal with great care. It’s obvious that the spectacular growth in revenue has been fuelled by the acquisition adventures. To show the benefit of these newly acquired activities without the costs of gaining them clearly gives an exaggerated view of the company’s cash-generating capability. That said, we consider that the figures for the most recent year, 2020, are useful. They give an idea of what the company’s cash generating capacity could be in future years, if it stopped making acquisitions and carried on operating the assets it now has.
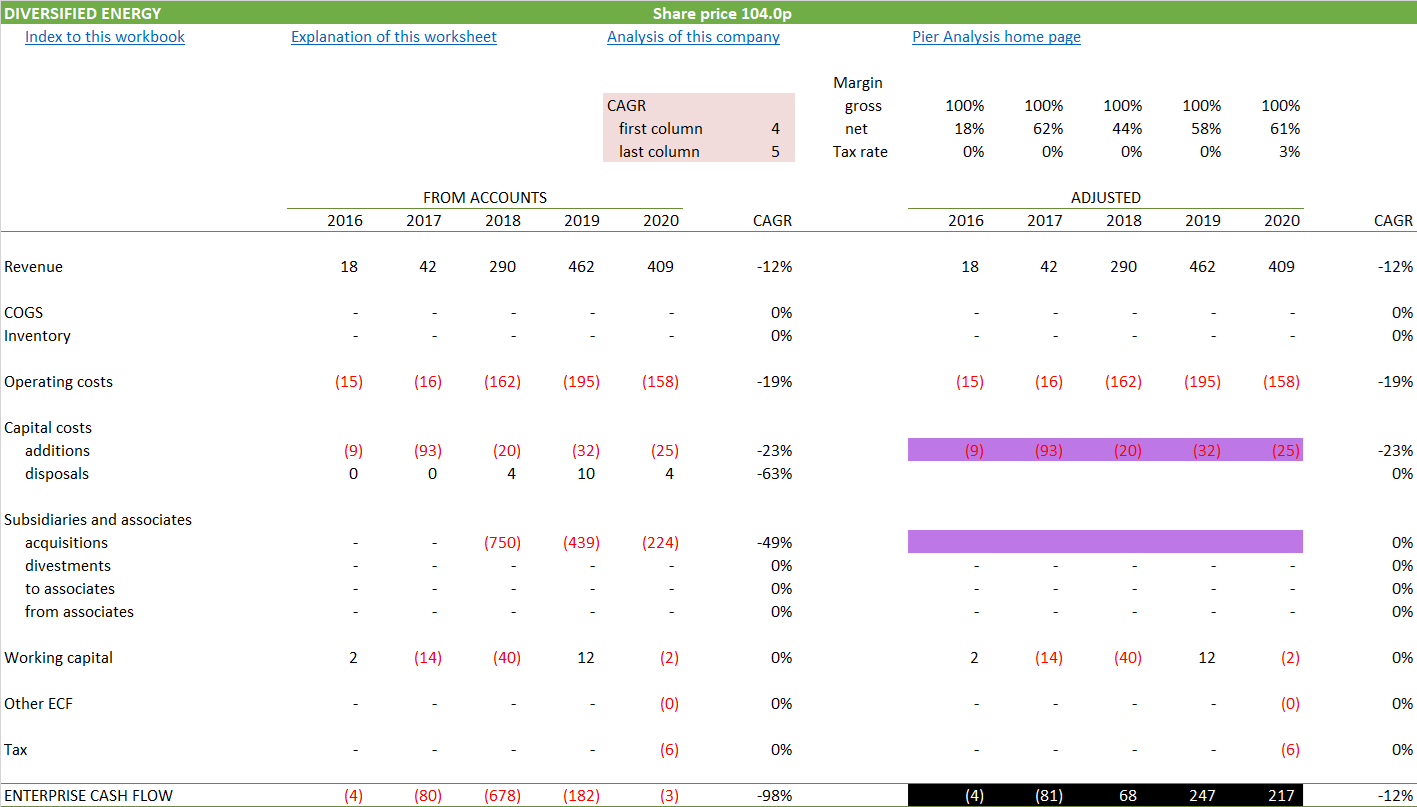
Highlighted in purple: We have eliminated the acquisition costs but kept the capital expenditure on the grounds that it is largely associated with sustaining existing operations rather than expansion.
Highlighted in black: We can see that in 2020 Diversified Energy’s underlying cash generation was around $217m in 2020.3
Diversified Energy seeks to capture a similar idea when it reports that it generated $247m of free cash flow. Among the differences between its measure of cash flow and ours in that
Diversified Energy includes cash interest costs; Pier Analysis excludes them because it is trying to measure the cash flow available to funders
Diversified Energy includes “recurring capital expenditures”, while Pier Analysis includes all capital expenditures.
Even when allowing for these differences, our impression of recurring cash flow is about $50m lower than the company’s.
Combination
We can place this new-found information about Diversified Energy’s recent cash generation alongside what we discovered earlier about what it needed to accomplish to justify its current valuation.
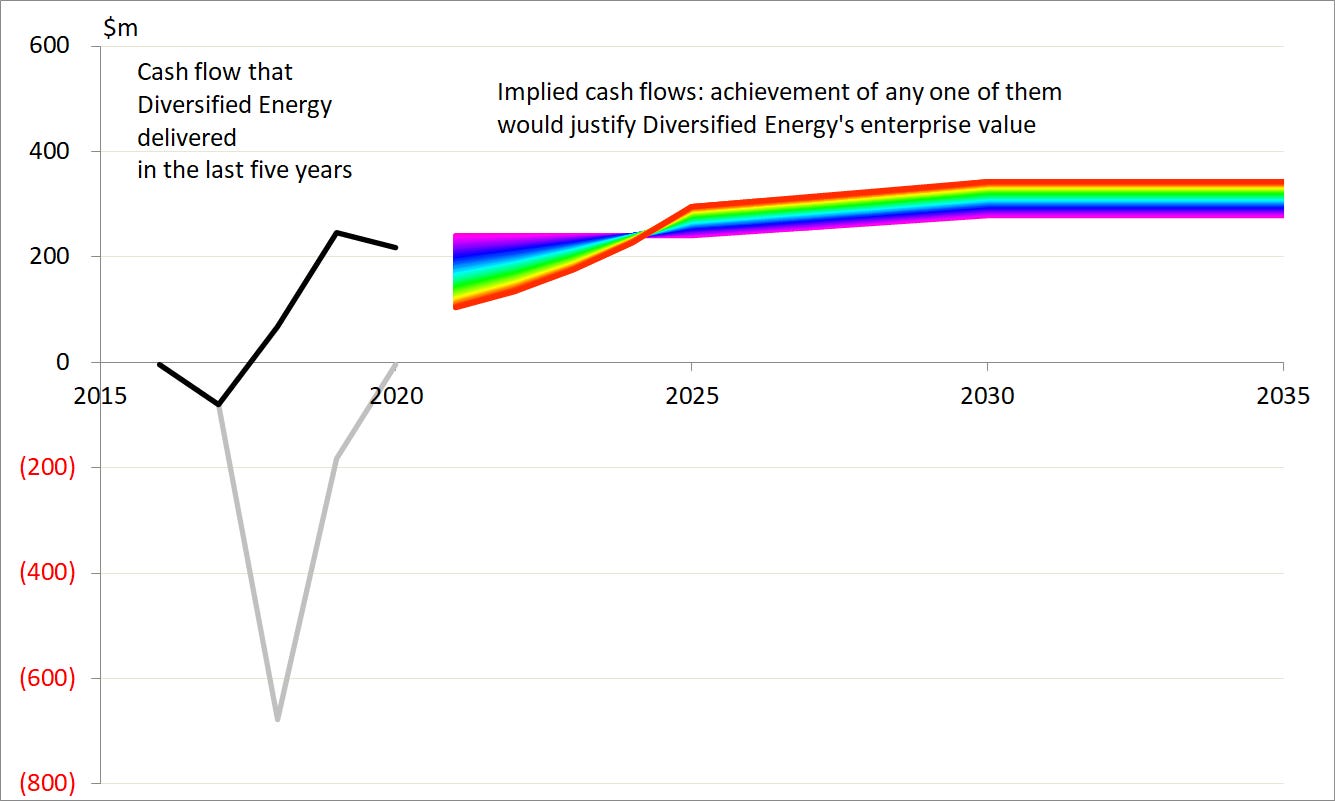
Highlighted in grey: The cash flow derived from the accounts above, where it was also highlighted in grey.
Highlighted in black: The cash flow adjusted above to eliminate non-recurring items, where it was also highlighted in black.
We can see that the underlying cash flow compares well with the near-term cash flows that the company needs to generate to be considered attractively priced.
Financing cash flow
How Diversified Energy funded its acquisitions is shown at the bottom of the cash flow statement, where the financing cash flows are shown.
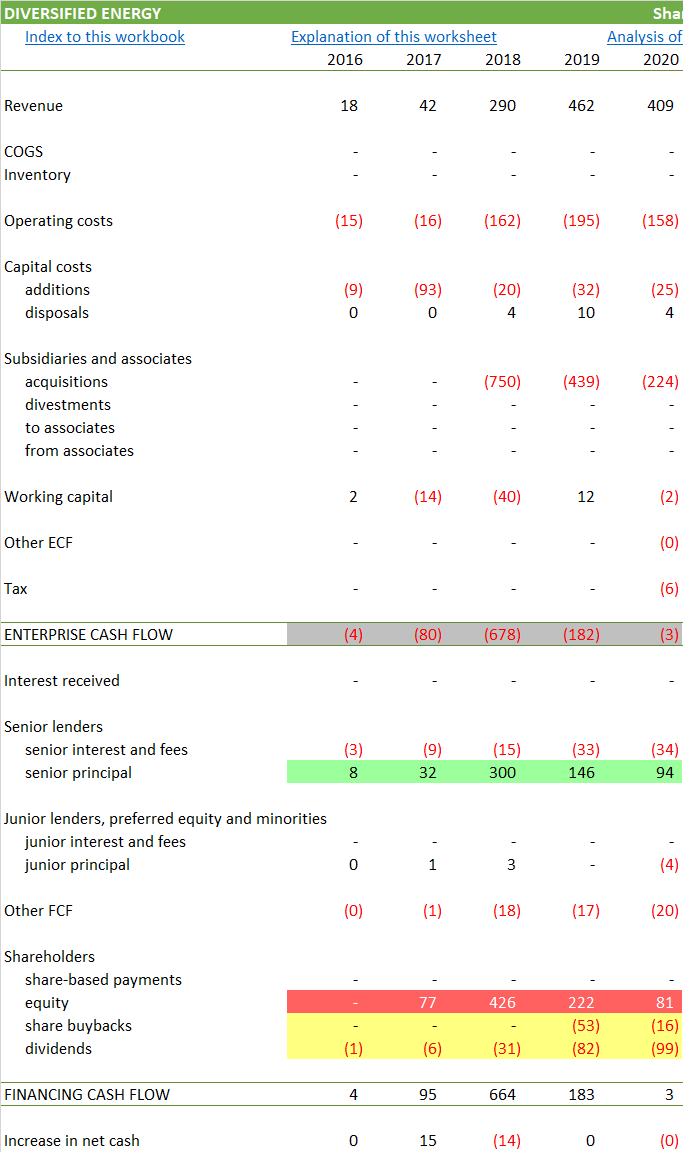
Highlighted in grey: As we have already seen, the enterprise cash flow has been negative to the tune of $948m over the last five years as a result of the acquisition programme.
Highlighted in green: $581m of this deficit has been funded by drawing new debt.
Highlighted in red: $737m has come from shareholders.
Highlighted in yellow: Over the same period, $219m has been paid out by way of dividends and another $69m used for share buybacks.
To Pier Analysis, paying dividends at the same time as borrowing or raising new equity makes little sense. Still less sense is made by offering to buy back shares at the same time as issuing new ones. It amounts to paying shareholders with their own money. Of course, it makes plenty of sense to the bank that arranges the new share issue and the buyback. More on that in a minute.
Diversified Energy’s management sees things differently. It is not even faintly ashamed of raising equity while paying dividends and offering share buy backs.
2020 STRATEGIC PROGRESS AND ACCOMPLISHMENTS
Higher Dividends per Share: We are generating an industry leading yield on the LSE, which is a function of a strong cash flows as evidenced by our ability to increase our dividend twice in 2020, amidst the Covid-19 pandemic and pricing downturn, paying a total of $99 million in dividends during the year.
DIVIDEND POLICY
The Board’s target is to return not less than 40% of Free Cash Flow to shareholders by way of dividend, on a quarterly basis, in line with the strength and consistency of the Group’s cash flows.
CAPITAL ALLOCATION STRATEGY
We are generating an industry leading dividend yield on the LSE.
DIVIDENDS DISTRIBUTIONS
~40% FCF Dividend payout ratio distinguishes us in the E&P space
EQUITY SHARE REPURCHASES
Optionality provides platform for additional value generation
The key idea behind Diversified Energy’s approach is that, in any given year, there are activities that it has already, and others that it newly acquires. In that year the cash flow associated with the new activities is obviously negative, as the cost of acquiring them is larger than any amount they could reasonably generate in the period. The cash flow from the existing activities is positive, because the cost of acquiring them has receded into the past, and they cost little to keep in a productive condition.
It is this second, positive amount that Diversified Energy’s management considers free cash flow. It aspires to pay 40% of that out in dividends, and apply the rest to retiring debt on the old assets and buying new assets. Such has been the pace at which the firm has acquired new assets that this free cash flow is nothing like enough to pay for them. As a result, it has had to tap banks for further borrowing and shareholders for more investment.
Diversified Energy is not alone in taking this approach. The subject of our last article, BP, did exactly this. Though the notion of free cash flow is subject to greatly varying interpretations, it is common for it to include cash flows associated with operating existing assets, but to exclude – indeed, be a measure of funds available to meet – investments needed for growth. The thinking gains support from the way accountants lay out cash flow statements. They make exactly this distinction, separating cash flows arising out of operations, investment and financing. Or at least, purporting to separate them; they don’t achieve it at all well.
On this basis, drawing debt and equity to fund new acquisitions while repaying debt and paying dividends on existing activities just about makes sense. 4 However, there are other widely used approaches to managing a company’s resources that avoid the jumble of inflows and outflows exhibited by Diversified Energy in its financing 5, 6 .
And who is to say Diversified Energy ’s strategies haven’t worked? Neither BP nor Shell can point to recent twenty-fold increases in revenues.
Oaktree Capital
Diversified Energy has formed a partnership with Oaktree Capital to structure these financings. It is led by Howard Marks, who produces reassuringly sensible memos to clients on the current investing climate.
Oaktree won’t be structuring these raisings of debt and equity for free. And that’s not the only way Oaktree is significant. Our instinct is that the workings of the arrangement between the companies will have a major effect on how much of the value created by Diversified Energy’s will filter out to its shareholders. That impression is driven by the details in the following passage.
Initial promote - Oaktree will provide DGO7 a 5% upfront promote (extra ownership) at the time of an acquisition, resulting in the following initial ownership split for a 50/50 investment:
DGO receives a 52.5% working interest for a 50% investment
Oaktree receives a 47.5% working interest for a 50% investment
Back-end promote - Upon achieving a 10.0% unlevered internal rate of return or “IRR” on its investment (by acquisition tranche), Oaktree will convey to DGO 15% of its remaining working interest (equal to an additional 7.125% incremental to DGO). Accordingly, once Oaktree achieves its 10% IRR:
DGO's ownership will increase to 59.625%
Oaktree's ownership will decrease to 40.375%
Investors can only really analyse their own position if they know which of the past acquisition tranches have delivered the 10% IRR to Oaktree, and how far from doing so are the ones that remain. The bold passage in brackets is interesting; to be able to perform the relevant calculation, DGO’s arms-length partner has to be able to see the performance of each acquisition separately, information that the company has not made available to its own shareholders.
Question 1: How long will production continue?
Whether Diversified Energy is attractive comes down to two questions. The first is: how long will production continue?
The company claims that the interests it pursues are “long-life, low decline assets” and in one graph it marks them as having a “50+ years remaining life”. If that’s the case then the Pier Analysis habit of truncating cash flows after the first 15 years looks unduly conservative.
We can find no detailed tabulation of the assets and their remaining asset lives in the annual report. What we can find is
an indication in the annual report that 2020 production amounted to “~105,000 net boepd” (barrels of oil equivalent per day)
elsewhere in the report, among “Key Facts”, reserves are estimated at “607MMBoe” (millions of barrels of oil equivalent).
Dividing one by the other works out at 15.84 years of production at current rates. That these are quite a way short of “50+ years” is perhaps explainable in two ways.
Production rates will decline, and some fields will close before others, so this maths can be true on average without necessarily contradicting the claim that at least some of the assets will remain productive for decades.
These are PDP reserves, that is, reserves that are proved, developed, and under wells that are actually producing. For most oil and gas companies this would be only a fraction of their reserves, and they would list less others that were less proven. One would fully expect a decent fraction of those additional reserves to make their way into production. In Diversified Energy, proved and producing reserves are what they make a feature of buying, and while there’s no doubt scope for opening up more than is in production right now, yet to be exploited reserves won’t have the significance that they do for an oil major.
Question 2: How long will acquisition continue?
The second question is how soon will the management have the discipline to accept the business at the size it is? As soon as it restrains its appetite for acquisition, it will be able to direct not 40% but 100% of its cash flow to funders, chief among them the shareholders. But it has so far given no indication of stopping. From the 2020 annual report:
Having completed $1.8 billion of acquisitions since 2017, we have proven our ability to identify, execute and integrate both corporate and asset type transactions that fit with our business model and asset base. We will continue to adopt this disciplined approach to acquisitive growth, acquiring assets that meet our strict criteria. Furthermore, the Group has targeted to maintain balance sheet Leverage below 2.5x Net Debt-to-Hedged Adjusted EBITDA (pro forma for acquisitions) and will continue to fund acquisitive growth through a prudent mix of debt and equity
[We will continue] complementary and synergistic growth in the Appalachian Basin through our healthy relationships with our development-oriented basin neighbours. There continues to be abundant opportunities as evidenced by our 2020 Carbon and EQT acquisitions as well as the recent transaction between EQT Corporation and Chevron.
The partnership [with Oaktree Capital] enhances our access to capital in an opportunity-rich acquisition market, and positions both parties for continued success when other market participants may lack the capital or management teams to transact.
[We will] Maintain Leverage: Utilise the existing liquidity on the balance sheet and the funds associated with the Oaktree agreement to capitalise on compelling opportunities presented by current market dynamics.
Arrangements with senior management have been carefully designed to encourage this growth. Their bonuses in 2021 are determined by reference to:
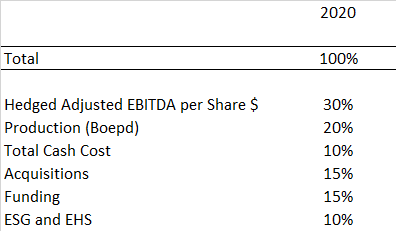
There is a perfect mapping between the topics we have been talking about and management’s incentivisation.
But now let us set out the same information against what the remuneration company has set as the basis for senior compensation in 2021.
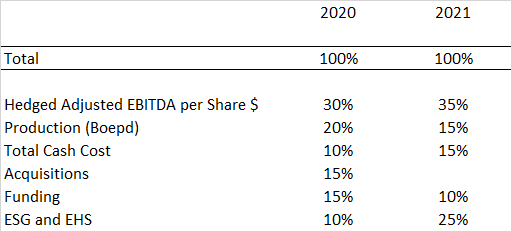
Strikingly, the weight attached to acquisition has been eliminated, and the largest focus is lifting hedged EBITDA per share. (ESG becomes prominent, too.) This gives grounds for suspecting that the firm’s thoughts might be turning to harvesting what it has built.
The resulting flicker of excitement is hard to reconcile with news in recent days that Diversified Energy and Oaktree are collaborating to make another very large purchase. This leaves management’s intentions hard to discern. The interests of Oaktree, clearly influential as a partner, are complicated too. It has no doubt made respectable hay out of the last decade’s financial manoeuvering and might like that to continue. At the same time it has a stake of around 50% in the same assets as Diversified Energy, and will want to turn them into cash eventually.
Checking the sums
If Diversified Energy does stop acquiring, with the cash flow that would be liberated it could repay its debt in not much more than four years. After that, shareholders would receive not 40% or so of cash flow, but 100% of it or more8; dividends would start delivering a yield of around 14.0% pa (our analysis shows 17.8% pa, but we need shade it back to allow for the tax that will become payable) on today’s market capitalisation.
That sounds attractive, but we need to remember that that cash flow would not last for ever. We have already found that the reserves amount to 16 years at current production rates. And a simple cash flow treatment does nothing to recognise the liability to decommissioning costs which the income statement covers well.
A simplified mental model would have that dividend yield continuing between years 4, when the debt was paid off, and 14, allowing two years before reserves were exhausted to pay for clear-up.9 Realistically, the gas would flow for much longer, gradually decaying instead of being constant, and the debt would be repaid over longer; but the framework is enough to show us an IRR of around 4.2% pa given today’s share price.
That doesn’t sound very much, but it assumes that
gas prices don’t rise, either in real terms or as a consequence of any general inflation
there are no further economies can be squeezed out of the costs
we’ve correctly inferred the reserve life. We may not have done. The annual report repeatedly suggests that Diversified Energy has selected reserves that are long lasting, but it is very light on information of this nature. If the reserves are good for 50 years rather than 16, the equity IRR looks closer to 9%.
Verdict
Diversified Energy has grown spectacularly, but before betting hard-earned cash on this one, we think it reasonable and prudent to ask for
fuller disclosure of the reserves than (unless we’ve missed it) the single figure published in the accounts
an understanding of the state of the Oaktree promote arrangements, acquisition tranche by acquisition tranche
more from the management and from Oaktree about their intentions for the business.
What next?
A distinctive feature of Pier Review is that it provides the financial model that underpins each analysis. To receive the spreadsheet and see how the numbers in this article are derived simply from the published accounts,
if you have not done so already, subscribe to Pier Review by using the box below
click here to pre-populate a message in your usual email program requesting that the spreadsheet be sent to you
switch to your email program and click Send to despatch the request.
If you find this analysis interesting, you can sign up to have others like it delivered to your inbox.
Share Pier Review with interested friends.
The company has field offices in Kentucky, Ohio, Pennsylvania, Tennessee, Virginia and West Virginia.
All of these profiles deliver net present values that match the $1936m enterprise value within 15 years when discounted at 10% pa.
Distinctive features of Pier Analysis’s approach are that it
searches for companies that could plausibly return their enterprise value within 15 years. The requirement is grounded in the belief that companies’ lives are distinctly finite, as evidenced by the large portion of companies that made up stock market indexes twenty years ago no longer existing today. The more orthodox approach is to regard companies as having no foreseeable or inevitable end, and so to count on them to continue to produce cash into perpetuity. Using a shorter period than usual builds a margin of safety into the evaluation. Limiting ourselves to 15 years may be a less controversial approach for oil companies than for others, given that some commentators openly doubt that these companies will be allowed to continue in business in their present form for very much longer.
discounts companies’ enterprise cash flows at a rate of 10% pa. The search for a rate of return of this size is grounded in the belief that funds that specialise in investing in infrastructure serve as an alternative home for readers’ capital, and this is the kind of return they deliver. The more orthodox approach is to take as the discount rate the weighted average cost of capital, or WACC, of the company being investigated. The WACC will be different for each company examined and for nearly all of them it will be lower than 10%. Requiring a higher rate of return than usual builds a margin of safety into the evaluation.
The impression of underlying cash flow that we gain from the adjusted cash flows is approximate, because it does not allow for the fact that the company would be liable for quite a bit more tax if in the absence of its prodigious investment in new properties.
Undertaking share buybacks while issuing new debt is harder to explain, but we imagine the rationale would be that share buy backs support the share price and so improve the cost of raising new equity. In a rational market this should not be so; raising less equity, as a result of making no share buyback, should be identical in terms of dilution to raising more equity in order to offset a share buyback, and the two should be perceived equivalently by investor. Relying on markets to be rational is scarcely fruitful in current times.
Project finance is the approach to financing ventures in natural resources, infrastructure and energy from which Pier Analysis draws its ideas. A company set up using that method would have a clear transition from drawing debt and equity to cover the costs of constructing an asset, to paying out the cash generated once the asset comes into operation to service debt and provide dividends. The raising of new debt and equity would preclude a simultaneous payment of dividends and buying back of shares comparable to that shown in Diversified Energy’s accounts.
The large and fashionable technology companies have prodigious positive cash flows. That’s different from Diversified Energy which, as we have seen, has its cash flow made negative by the cost of its acquisition programme. Many of these businesses would rather allow cash and investments to pile up than pay it out to shareholders. Some started to pay dividends only fairly recently; others still don’t do so. What they certainly don’t do is copy Diversified Energy in borrowing and raising equity at the same time as buying back shares and paying dividends.
Here DGO stands for Diversified Gas and Oil, the old name for Diversified Energy.
100% of Pier Analysis’s measure of enterprise cash flow, but more 100% than the current levels of of Diversified Energy’s measure of free cash flow, the amount of which it promises shareholders 40%, because it is calculated after deducting interest payments, which would cease once the debt was repaid.
Two years of cash flow is close to the decommissioning liability recorded on the balance sheet.