


BP
Why choose BP when you could have Shell?
Depending on how you define Britishness, BP is the first or second largest oil company in the UK.1 In business since 1939 and once called British Petroleum, it is generally considered to be one of the world's supermajors, alongside Shell, Chevron, ExxonMobil, ConocoPhillips, Total and Eni.
All these companies suffered last year. Neither tourists nor business types are flying. For many people it has been months since they had a reason to drive their cars. Oil and gas prices have collapsed as a result. At some points in 2020 the oil price was negative. Oil companies have been hit twice: they have sold a bit less, and got much less for what they did sell. News coverage in August 2020 had headlines screaming that BP had halved its dividend as a result of massive losses. For a short time the share price fell below £2. Anyone who bought at the peak less than two years earlier would have waived goodbye to two thirds of their investment.
The losses reported were indeed chunky: $6.7b in a single quarter, the result of recognising that assets were no longer worth what had previously been imagined. But we don't think that the dividend cut is uniquely the consequence of the losses. BP's dividends had been larger than the cash it was generating for several years. That situation would be unsustainable in steady times. Even more is it inconsistent with the investment that will be needed to make the transition from a producer of oil to a producer of renewable energy. The cut was overdue and would have had to come sooner or later. Covid provided a convenient justification for the inevitable. 2
Enterprise value
BP’s balance sheet shows that it has
Highlighted in red: debt of $82b
Highlighted in yellow: cash of $31b
Highlighted in orange: As a result, net debt of $50b
Highlighted in purple: A pension deficit of $1b.
Click on this table to enlarge it if it is too small to read.
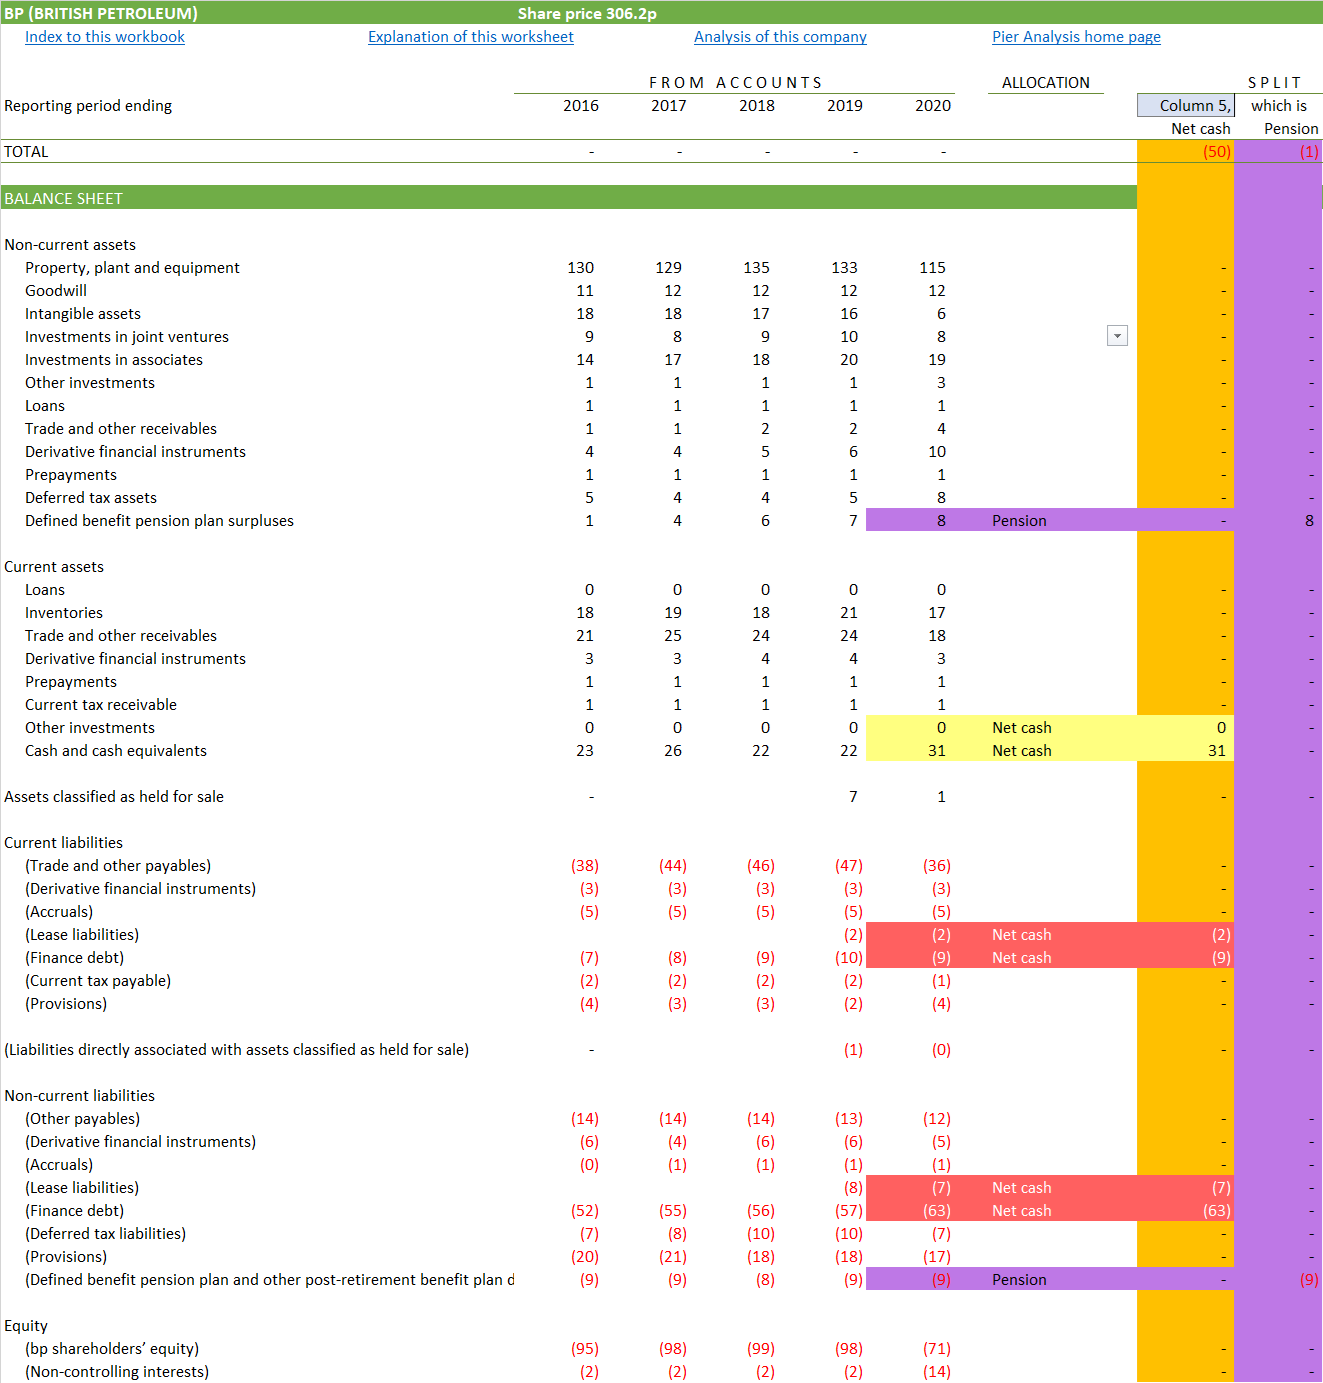
These items indicate how much BP owes to its lenders. For these purposes, we consider obligations to former employees as debt like any other.
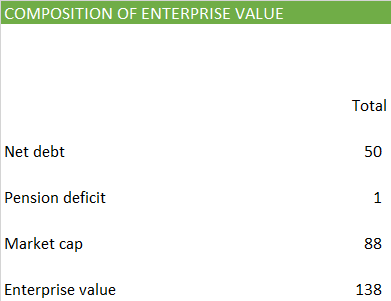
We use BP’s market capitalisation as a measure of how much its investors believe they have at stake in the business. It stands at £63b, equivalent to $88b
When we put these things together, we see that BP has an enterprise value of $138b.
Required cash flow
Given this enterprise value, it’s a matter of simple maths to work out how rapidly BP needs to generate cash in the coming years to deliver a return of and on these amounts to lenders and shareholders. There are countless ways BP could accomplish it.
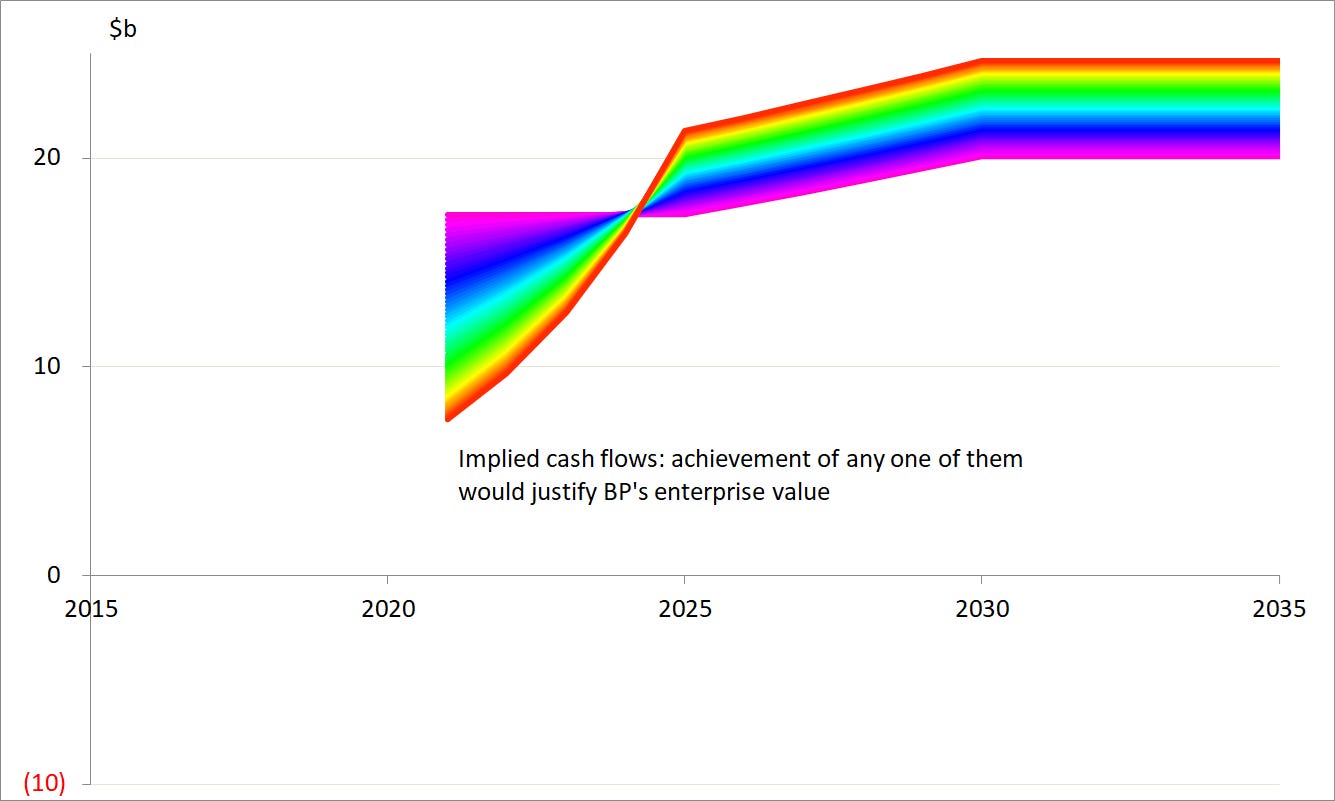
Among the hundreds that we show in the chart, there are ones
with a violet hue, which start at $17b and rise only a little over time to $20b
at the red end of the spectrum, which start low at $7b, but offset that by rising quickly so that they eventually get as high as $25b. 3
Actual cash flow
Now that we have some idea of what BP’s cash flows need to look like if it is to be an attractive investment, let us look at the recent past to see what BP actually delivered. Like nearly every other large company, BP presents its cash flows using a layout that is incomprehensible to most people. It is much easier to understand what is going on if they are represented in a simple way that starts with revenue, and subtracts successive categories of costs until we find what’s left for the providers of finance, that is lenders and investors.
Highlighted in yellow: We can see that BP’s revenues were growing nicely between 2016 and 2018, but faltered badly during the pandemic.
Highlighted in grey: Even so, BP has managed to keep its cash flow positive.
Highlighted in green: It has done this by controlling its costs and putting the brakes on new investment.
Click on this table to enlarge it if it is too small to read.
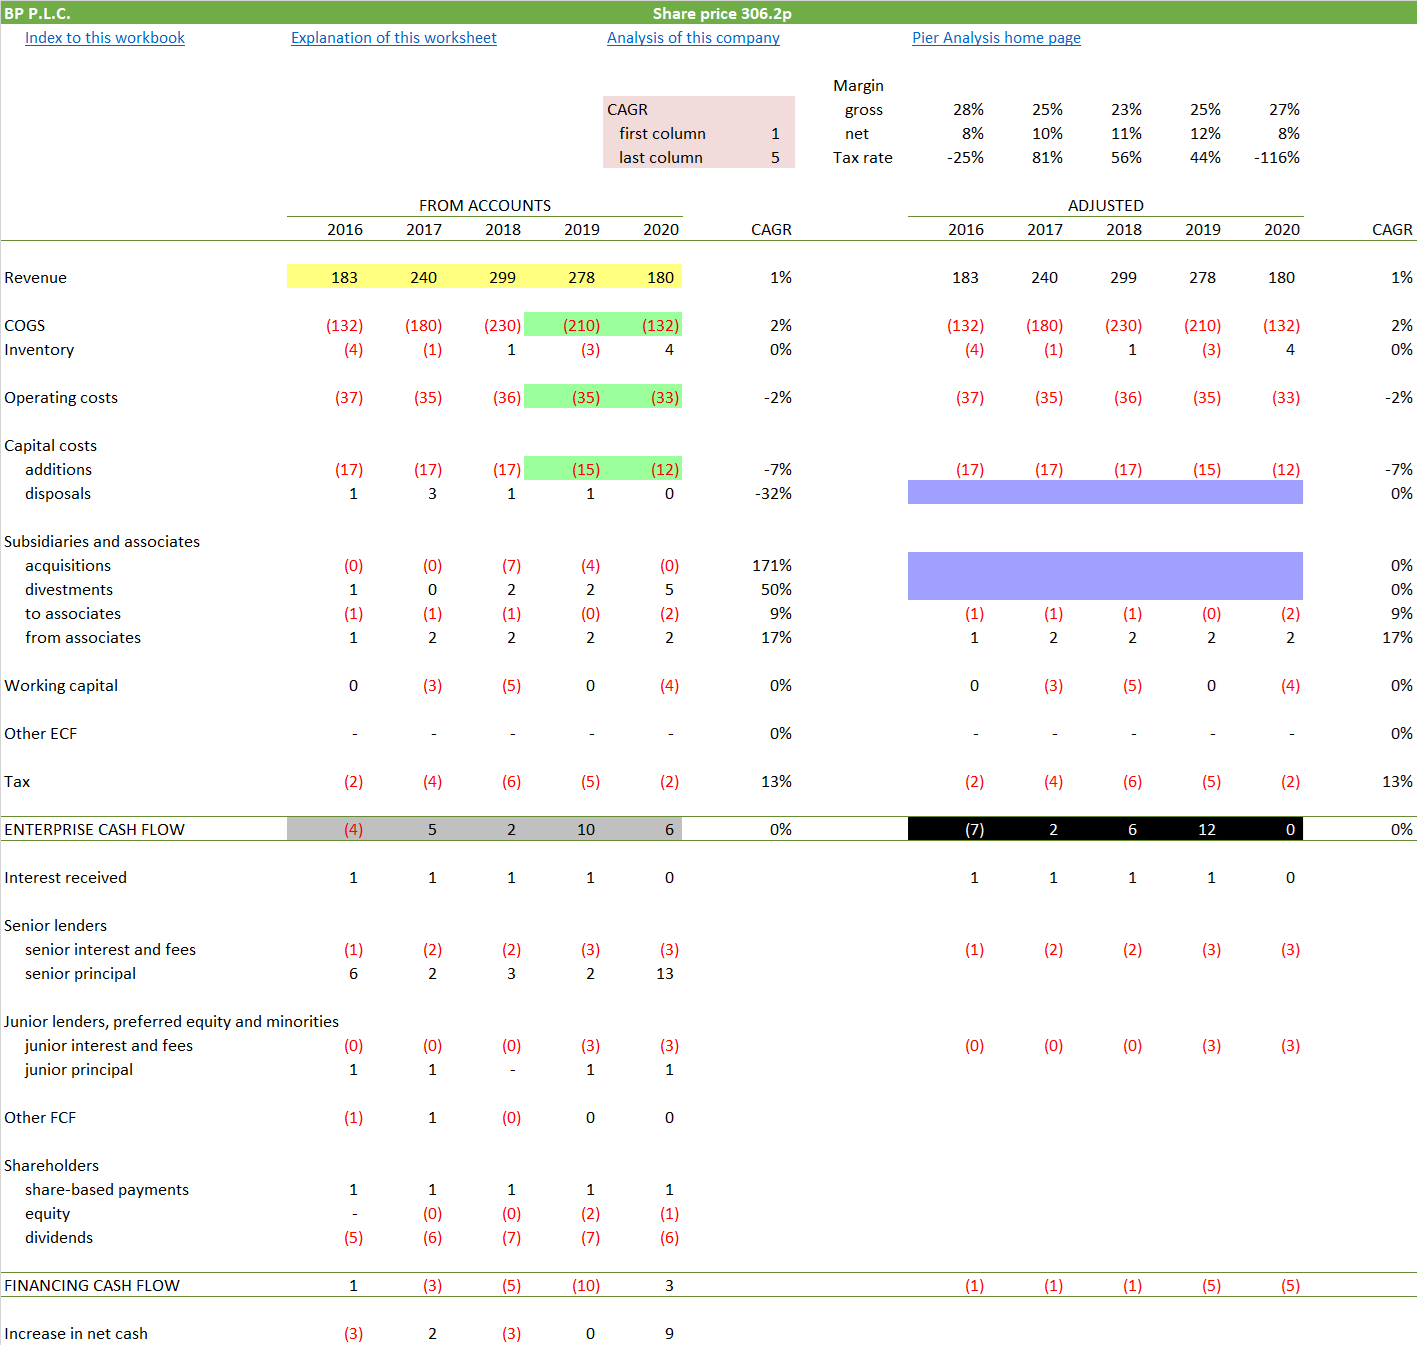
What we have been looking at so far, on the left, are what is set out in the financial statements. On the right are the same numbers, adjusted to remove items that are one-offs, with the intention of getting some sense of BP’s underlying ability to generate cash.
Highlighted in blue: We’ve eliminated the purchase of new subsidiaries and the sale of unwanted old ones.
Highlighted in black: We can see that in 2020 BP’s cash generation was essentially zero.
Combination
We can place this new-found information about BP’s recent cash generation alongside what we discovered earlier about what it needed to accomplish to justify its current valuation.
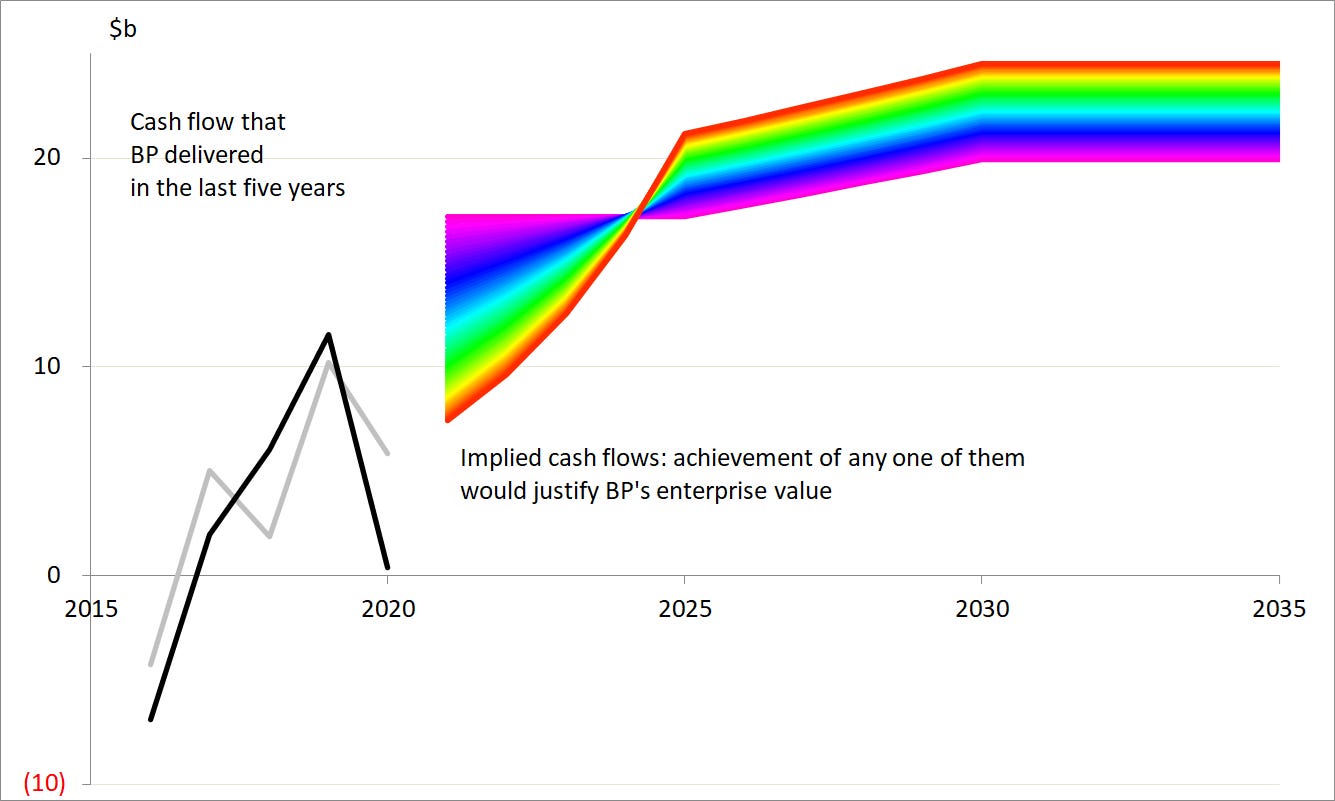
Highlighted in grey: The cash flow derived from the accounts above, where it was also highlighted in grey.
Highlighted in black: The cash flow adjusted above to eliminate non-recurring items, where it was also highlighted in black.
We can see that from an average of around $3-4b in recent years, BP needs to lift its cash flow to more like $15b if its valuation is to make sense. If this was a consumer products business such as Apple we would judge an increase on that scale to be implausible. It is less so for an oil company because its cash flow could jump by the required degree if the oil price ticked up sharply, as some speculate that it will do.
Financing
It is out of this enterprise cash flow that BP has to service its debt and pay dividends.
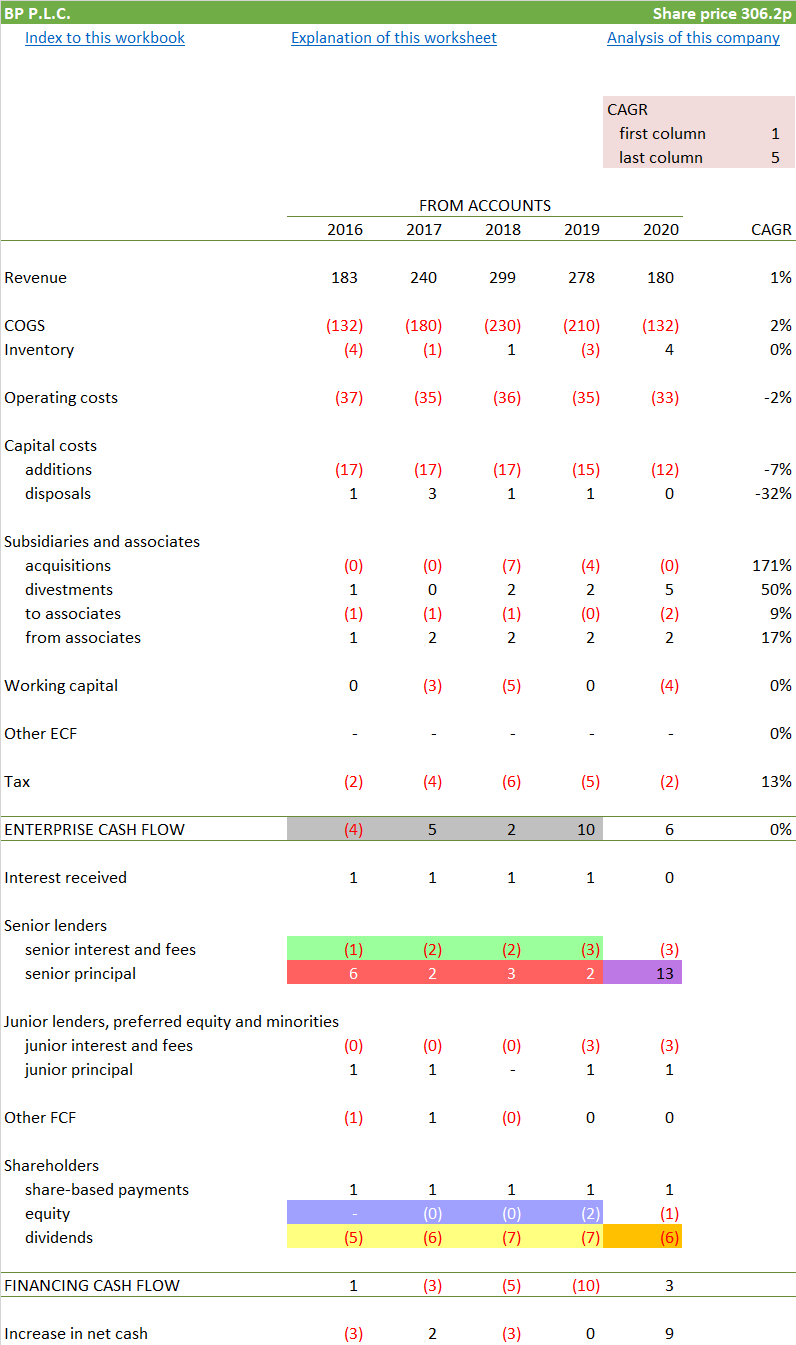
Highlighted in grey: Between 2016 and 2019 (leaving out 2020 as exceptional pandemic circumstances apply) the enterprise cash flow averaged $3-4b, as we have just seen.
Highlighted in green: During this time BP’s interest bill averaged $2b.
Highlighted in yellow: Dividends were around $6b.
Highlighted in blue: BP engaged in some share buy backs as well (remember: at nearly three times today’s price, though that is hindsight)
Highlighted in red: These numbers clearly don’t add up, and BP had to borrow to make up the difference. The consequence is that BP’s net debt rose from $27b to $45b over the period.
We can see the consequences of the pandemic in the 2020 result.
Highlighted in orange: The effect of the dividend cut is beginning to be visible. The reduction applied to only one of the quarterly dividends in that year and will have a greater effect in 2021.
Highlighted in purple: BP needed to borrow more heavily than in previous years.
In general, we think boards are misguided when they sanction borrowing to pay dividends.4 However, BP is not alone in doing it. Particularly in the oil industry, some companies advertise the policy as a feature rather than a bug. We intend to choose one of those as the subject of our next article, which will allow us to say more on this subject.
Alternatives
If you wish to have some exposure to a large oil company, in the hope that it will benefit from a post-pandemic firming of the oil price, and go on to be a winner in the transition from hydrocarbons to renewables, there is no dimension that we can see along which to prefer BP when you could have Shell, which we covered on 13 April 2021.
Shell did better at controlling costs when Covid drove revenues down. Its underlying cash flow rose. BP’s evaporated.
Shell has a more disciplined dividend policy. Both firms cut their dividends recently, or “rebased” and “reset” them as their annual reports had it; but Shell cut harder and earlier and even before that, it was never borrowing to fund its pay-out.
The fact that it shows stronger discipline in these two areas make it much easier to believe that Shell can successfully make the business transformation that both it and BP are attempting now.
The cash flows that Shell has to generate in the future if its current valuation is to make sense are much more plausible extrapolations of what it has managed in the last few years than the BP equivalents. That’s a windy way of saying that, relative to the recent performance of the company, Shell shares are cheaper.
Conclusion
The criteria that Pier Analysis applies are unusually demanding. They are represented by point A in the chart below: a requirement that the company generates cash flow sufficient to provide a 10% pa return on enterprise value over fifteen years. The point lies on the blue contour, which, the annotations at the right show, correspond to a requirement that BP’s cash flow can grow from recent levels5 at around 15% pa.
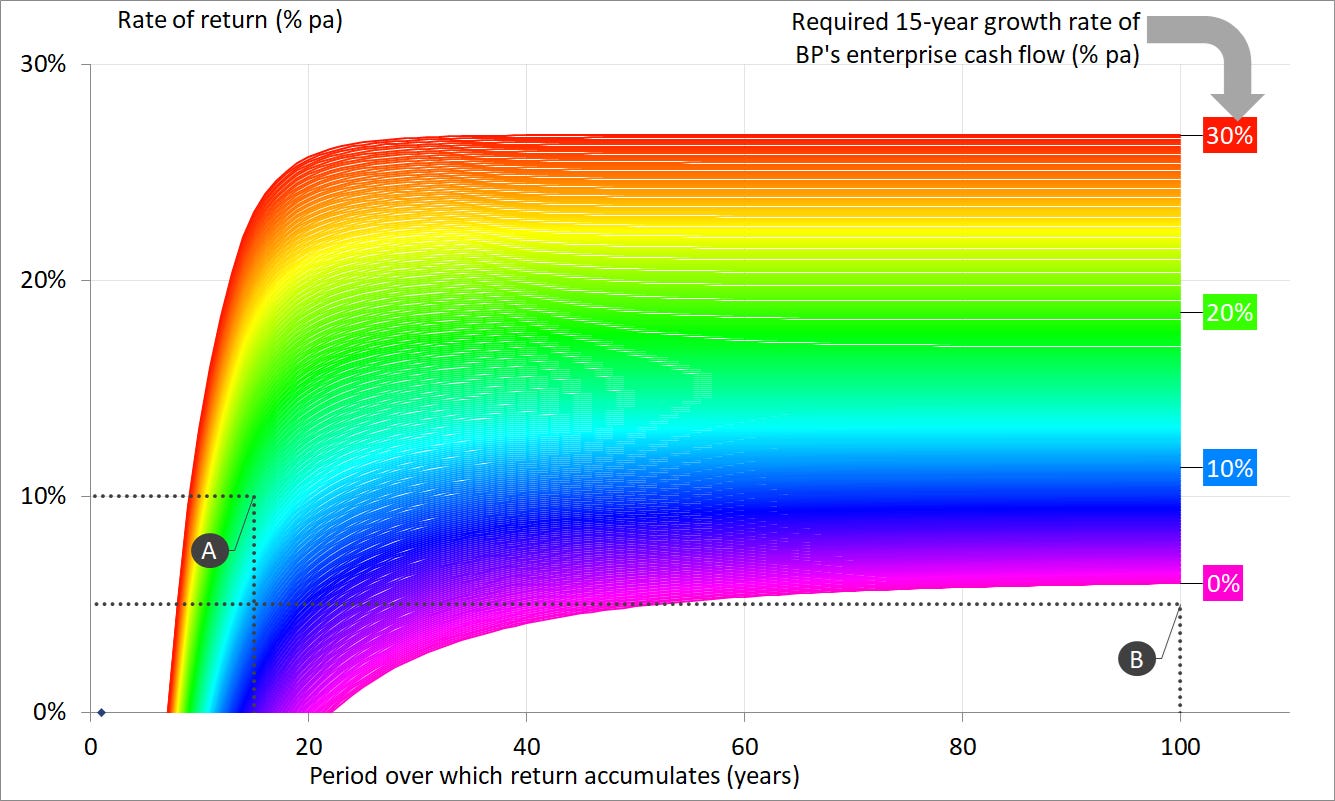
Point B shows what the position looks like to those who are willing to tie their money up in the company indefinitely, and would be content with a return of just 5% pa on the grounds that it is at least more than they are getting from bank deposits. It takes a certain kind of courage to bet on the oil companies hanging on indefinitely to what, in good times, has been a high margin business. For those who do have that courage, BP is priced to shrink. Making contrarian bets of that kind is a good route to a fortune, so long as your judgement turns out to be right.
What next?
A distinctive feature of Pier Review is that it provides the financial model that underpins each analysis. To receive the spreadsheet and see how the numbers in this article are derived simply from the published accounts,
if you have not done so already, subscribe to Pier Review by using the box below
click here to pre-populate a message in your usual email program requesting that the spreadsheet be sent to you
switch to your email program and click Send to despatch the request.
If you find this analysis interesting, you can sign up to have others like it delivered to your inbox.
Share Pier Review with interested friends.
Shell is considerably larger than BP but is not called Royal Dutch Shell for nothing; its headquarters are in the Hague and more of its shares are quoted in Amsterdam than in London. If it is thought of as British then it is the largest UK oil company; if it is thought of as only half British, then BP is the largest.
BP is not alone. We saw a couple of articles ago that LVMH shut down its loss-making Thomas Pink shirt retailing operation. It had tolerated negative margins for years, but Covid provided cover for closure.
All of these profiles deliver net present values of that match the $138b enterprise value within 15 years when discounted at 10% pa.
Distinctive features of Pier Analysis’s approach are that it
searches for companies that could plausibly return their enterprise value within 15 years. The requirement is grounded in the belief that companies’ lives are distinctly finite, as evidenced by the large portion of companies that made up stock market indexes twenty years ago no longer existing today. The more orthodox approach is to regard companies as having no foreseeable or inevitable end, and so to count on them to continue to produce cash into perpetuity. Using a shorter period than usual builds a margin of safety into the evaluation. Limiting ourselves to 15 years may be a less controversial approach for oil companies than for others, given that some commentators openly doubt that these companies will be allowed to continue in business in their present form for very much longer.
discounts companies’ enterprise cash flows at a rate of 10% pa. The search for a rate of return of this size is grounded in the belief that funds that specialise in investing in infrastructure serve as an alternative home for readers’ capital, and this is the kind of return they deliver. The more orthodox approach is to take as the discount rate the weighted average cost of capital, or WACC, of the company being investigated. The WACC will be different for each company examined and for nearly all of them it will be lower than 10%. Requiring a higher rate of return than usual builds a margin of safety into the evaluation.
Pier Analysis draws on ideas that are standard in project finance, an approach to raising funds widely used in energy, infrastructure and natural resources. Loan agreements in that field specify various mechanisms limiting the borrower’s ability to pay dividends, the effect of which is that it would be impossible to raise more debt to fund dividend payments.
Normally we would be looking to see what was a plausible extrapolation from the 2020 cash flow, but the pandemic has made that essentially zero after adjusting for non-recurring items, so in this case we have taken the average enterprise cash flow from the last three years.