


Sainsbury
A grocer with a commitment to financial services
Two regular readers have asked that Pier Review covers Sainsbury. Its share price has risen by 50% since September. A research note, reaching Pier Analysis by a roundabout route, argues that it would make a good LBO candidate. Daniel Kretinsky, a Czech investor, has taken a 3% stake in the company, and Pzena, a US value fund, has taken 5%.
British readers will think of the assets of Sainsbury in terms of a vivid orange livery, adorning the web site, trucks, vans, stores, and shopping bags. In fact, only two thirds of the business takes this form. Over a quarter of the assets reported on its 2020 balance sheet are represented by money owed by customers who have borrowed it from Sainsbury Bank.
As we've seen in recent articles, Sainsbury is not alone among retailers in operating a bank.
Marks and Spencer has its name on M&S Bank, but outsources the management to HSBC, taking half of any profits but none of any losses.
Tesco has a bank, but it is declining in importance to the point that the annual report scarcely mentions it.
By contrast with these competitors, Sainsbury's commitment to banking has been large and growing.
It bought out its 50% partner Lloyds Bank in 2014, and the proportion of Sainsbury that is accounted for by its bank has undergone a further doubling since then.
Just one note to its accounts, Note 29, consumes ten pages in addressing Financial Risk Management, which is largely about the banking operation.
The senior independent director is a banker, prominent enough to chair the UK's Banking Standards Board.
One Pier Review reader, likely to be in a position to know, responded to our Tesco piece by saying that Tesco was never strongly committed to banking, but felt the need to match its rival when Sainsbury went in to that activity with vigour.
These days Sainsbury divides its accounts between its retail operations and "financial services". Previously it labelled these activities Sainsbury Bank, but it switched to the more general term because its financial business now extends well beyond Sainsbury Bank.
In 2016 Sainsbury bought Home Retail Group, operator of Argos, a UK-based catalogue retailer, and with it came that business's own credit-providing operation.
Sainsbury also bought Nectar, an operator of loyalty cards, no doubt in an effort to match the insights into shopping habits that Tesco gains from its successful Clubcard. A difference between the two schemes is that while Tesco Clubcard points can be redeemed at a small number of partner organisations as well as at Tesco, Nectar points can be earned as well as spent in quite a number of other UK retailers. To that extent they resemble a currency, and Sainsbury's provision of the service to fellow retailers is a further enmeshment with finance.
So individuals contemplating investing in Sainsbury need to recognise that they are not considering a retailer, but, to a noticeable degree, a financial services business. Pier Analysis is far from keen on banks, because they are not amenable to analysis using the cash flow focussed approach that it advocates. The concept of enterprise cash flow which Pier Analysis seeks to quantify is not even meaningful for a bank [1]. If you can't explain to your grandmother how a business generates cash, you have no business investing in it.
Nevertheless, let us for now set aside these misgivings and see how Sainsbury's ability to generate cash relates to its current valuation.
Enterprise value
To understand the current valuation we start by seeing how much those who have lent money to Sainsbury have at stake in the business, as set out in its balance sheet.
In doing so we have to be thoughtful about IFRS 16. As we saw in our coverage of Marks and Spencer, this new way to account for leases affects retailers who rent a large fraction of their stores and warehouses under long leases, rather than owning them outright. The accounts for 2020 are prepared under the new rules, with the result that reported debt levels have quadrupled. It is an illusion; the 2020 figures can't be compared with previous years until adjustments are applied to make them consistent. Pier Analysis has made these adjustments to Sainsbury's past accounts. The information available only allows them to be estimated, and they may be a little way off the true figures.
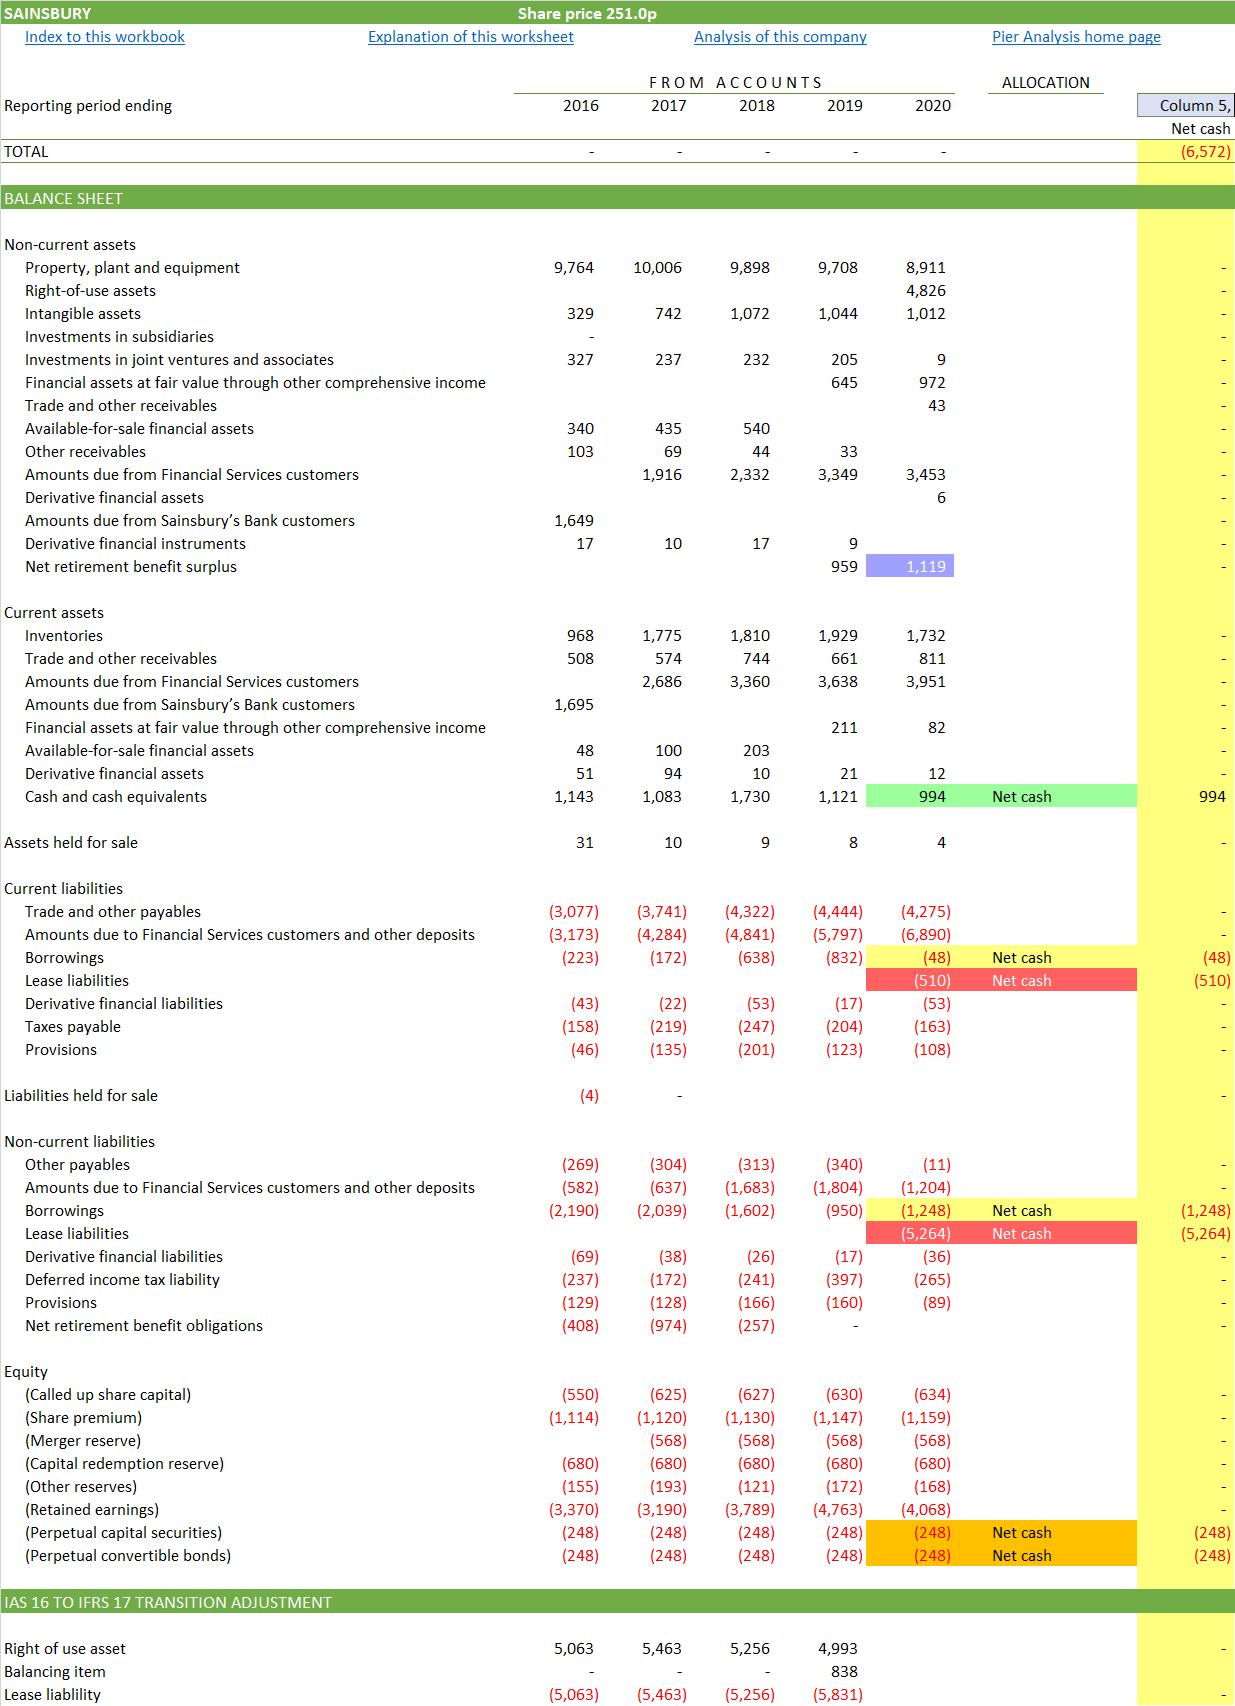
Highlighted in red: A measure of the amounts owing under the leases just mentioned and newly recognised as debt.
Highlighted in orange: Part of Sainsbury's financing is what it calls perpetual capital. At some points the accounts consider that a kind of debt, at others a species of equity. Pier Analysis treats it as junior debt.
Highlighted in yellow: When these amounts are combined with other varieties of debt, Sainsbury can be seen to owe its lenders and landlords £7,566m.
Highlighted in green: This amount is offset by £994m of cash, making net debt of £6,572m
Highlighted in blue: At the moment the firm's pension plan is in surplus. When a pension fund is showing a deficit, Pier Analysis regards the shortfall as a debt just like any other, one owed to its former employees rather than to a bank, but no less of a liability for that. When the fund is in surplus, Pier Analysis ignores it: inconsistent, but prudent, as such surpluses have a habit of disappearing.
At the share price of 251p on 26 Jan 2021, the market capitalisation of the company's equity is £5,580m.
Together, these items give us an enterprise value for Sainsbury of £12,152m.

Required cash flow
Pier Analysis requires this enterprise value to be paid back to lenders and shareholders within 15 years, and to earn in addition a return of 10% pa during that period. This is a conservative approach, and intentionally so. The norm is to look for a return which is typically below 10%, and to allow that return to be delivered over a much longer period.
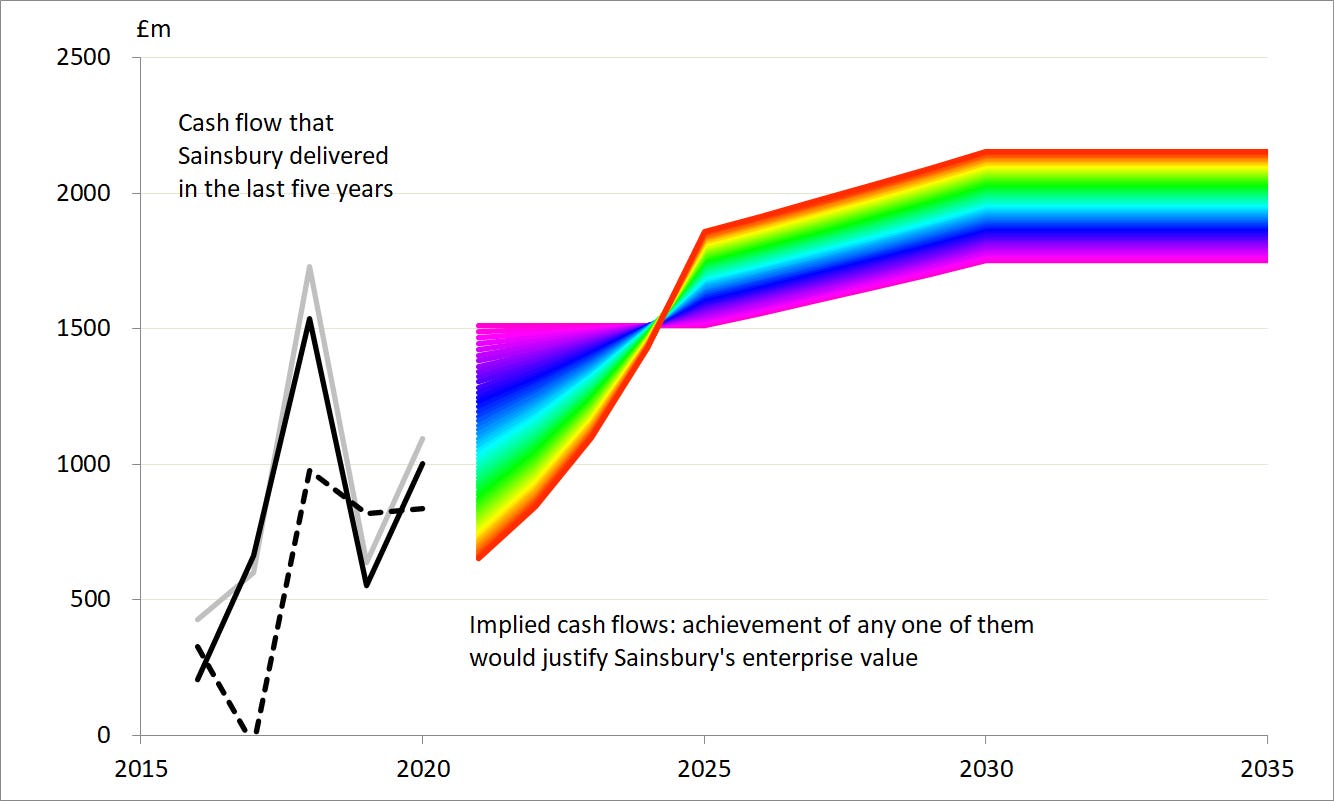
An investment in Sainsbury would be justified if we were confident that the company could generate £1,511m of cash flow, and that figure rose just a little over time to £1,751m. This is the violet line on the chart below.
Equally, an investment in Sainsbury would be justified if the company could be relied upon to generate cash flow that started lower, at £651m, but rose more quickly to reach a higher plateau of £2,154m. This is the red line on the chart. Growth at this pace is plausible in some industries, but high street retail is not among them.
There are countless other possibilities between and beyond these extremes.

Enterprise cash flow
It is against these hopes for the future that we can compare Sainsbury's actual recent cash flow. We can understand how these cash flows are built up, and how they have evolved, by looking at a cash flow statement. Ours is laid out using a direct presentation, starting intuitively with revenue, and deducting cash costs until one arrives at what is left for shareholders, or retained in the bank. Pier Analysis insists that this layout is more intuitive and insightful than the indirect presentation favoured by accountants and offered up in the annual report.
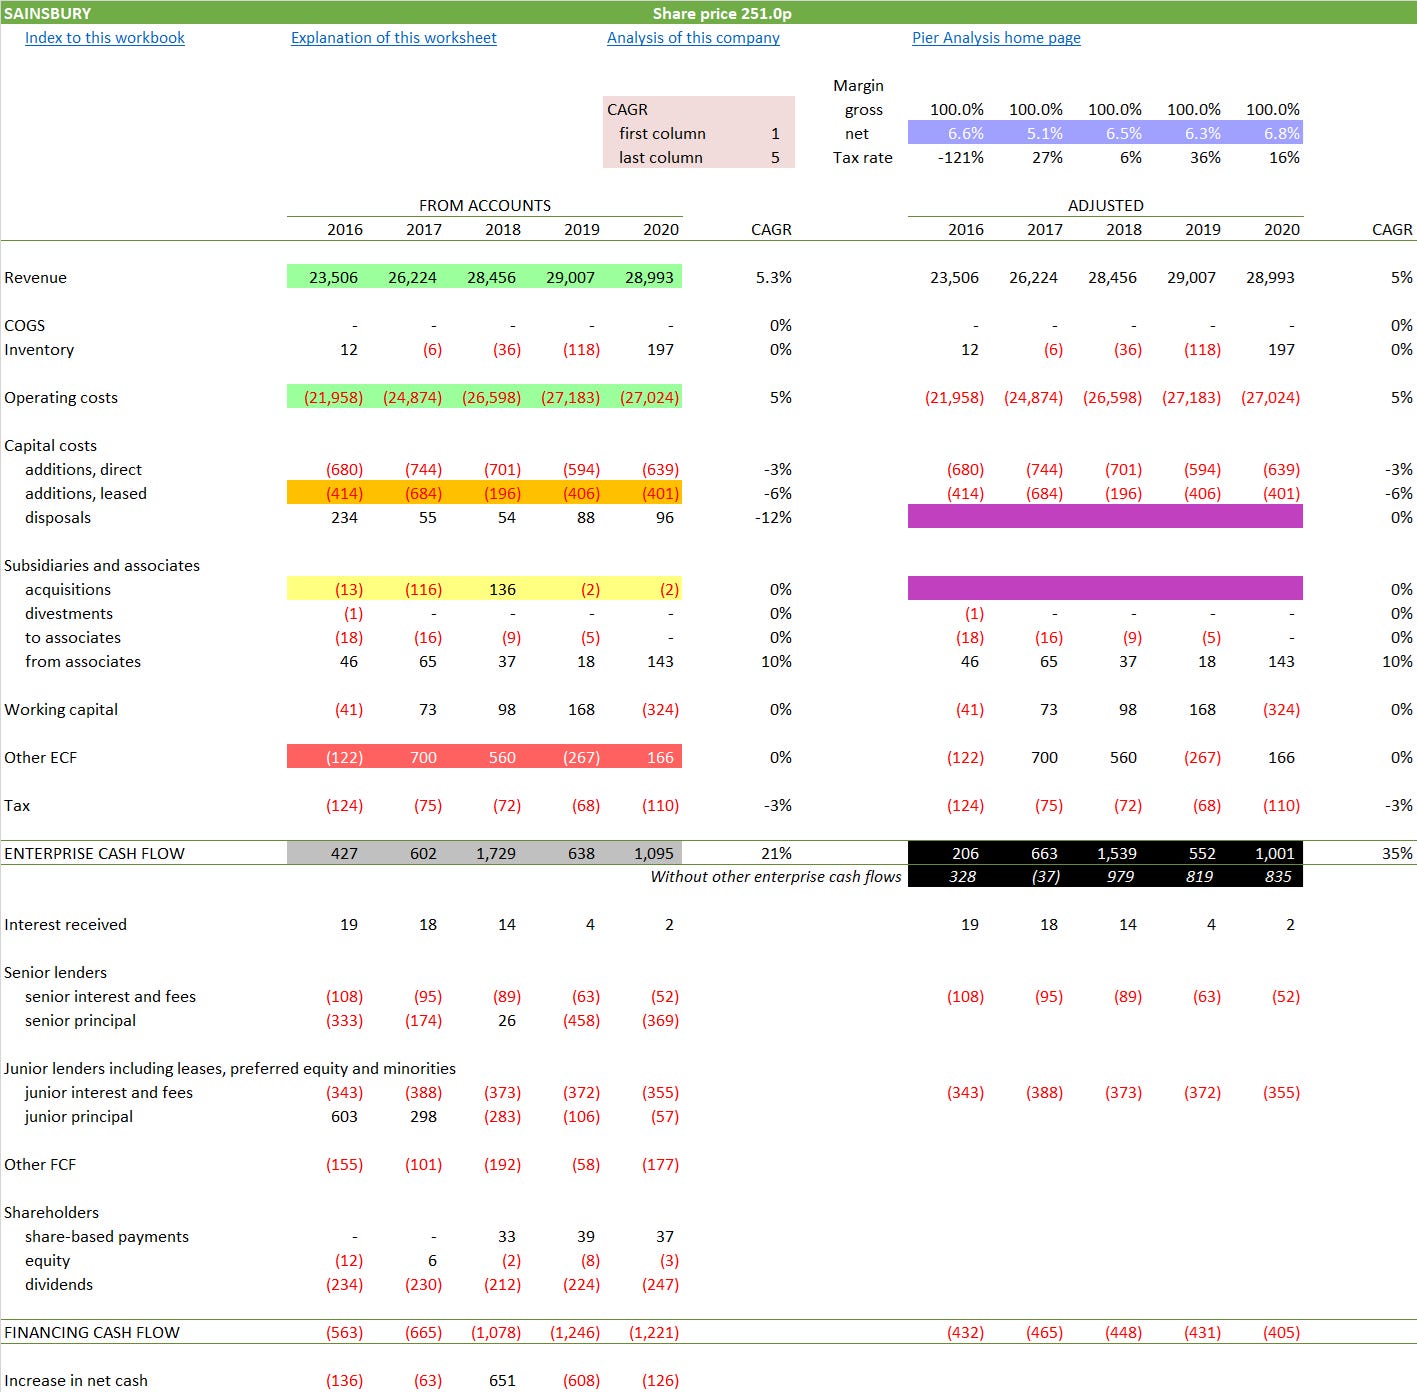
Highlighted in yellow: Most years the acquisitions are represented by negative numbers, consistent with them causing an outflow of cash. The purchase of the Nectar loyalty card operation is among them. Unusually, the one in the middle, for 2018, is a positive number. It relates to the purchase of Argos, paid with a lot of shares and a little cash, sufficiently little that it was less than the cash that Argos brought with it into the business. The net result appears as an inflow of cash.
Highlighted in green: Revenues and costs grew no faster than 1% pa on average between 2018 and 2020. They grew faster between 2016 and 2018. Not at all coincidentally, those years were marked by acquisitions, particularly Argos.
Highlighted in blue: Expressed on a cash basis rather than on the more usual accruals basis, margins are stable.
Highlighted in red: The line "Other ECF", for other enterprise cash flow, is dominated by the financial services flows already discussed.
Highlighted in grey: Sainsbury has generated an average of over £1000m of cash flow in the last three years.
Highlighted in purple: In an effort to gauge Sainsbury's underlying ability to generate cash, the proceeds of asset disposals are removed as they cannot be relied upon to recur. Similarly, the costs of acquiring subsidiaries are removed.
Highlighted in black: These better estimates of Sainsbury's recent capacity to generate enterprise cash flow are provided in two forms, with the banking cash flows (captured in "Other ECF") and without.
The trends in these measures of enterprise cash flow are more easily visualised when we graph the quantities highlighted in grey and black.
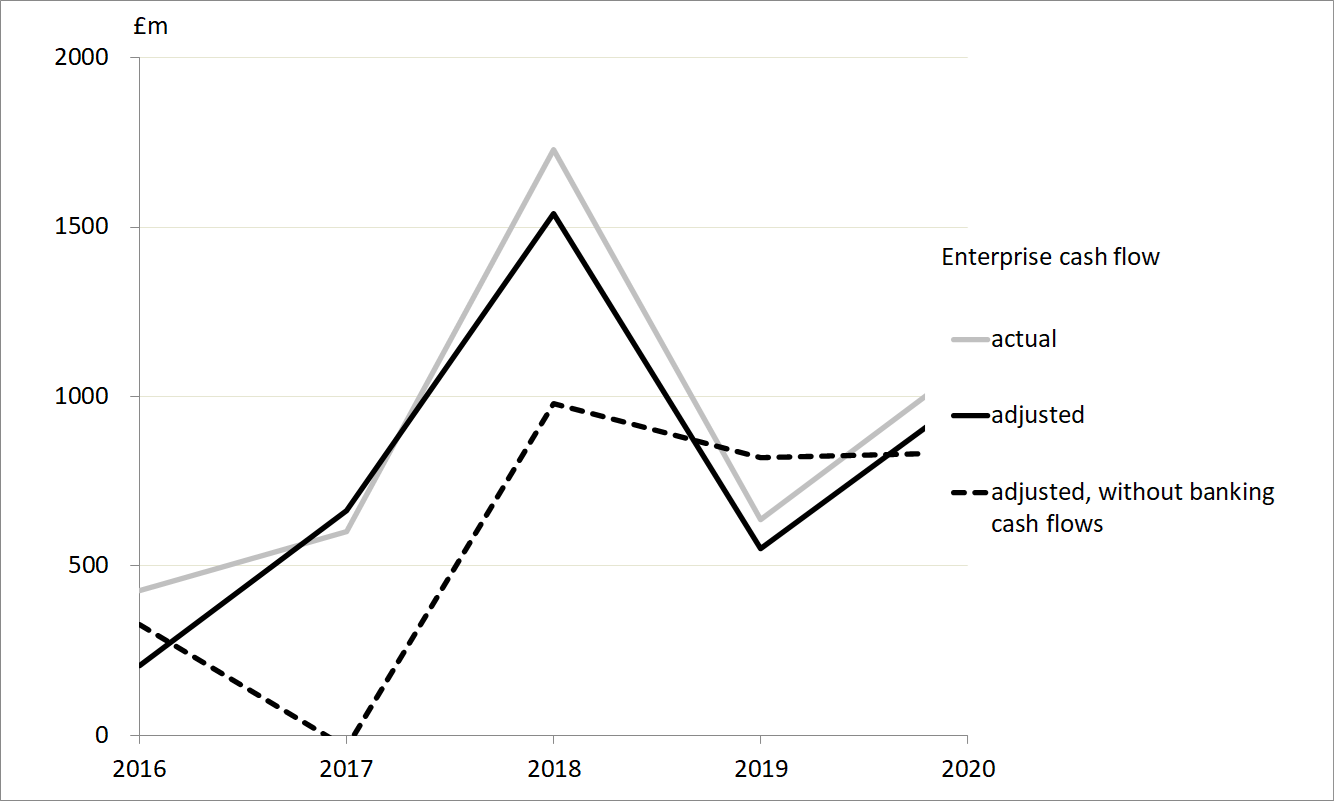
We can see that in 2018 the financial services business was the source of a large fraction of Sainsbury's enterprise cash flow. In 2017, it was the source of all of it. This money is described in the accounts "Increase in amounts due to Financial Services customers and other deposits", in other words money that savers have placed in the bank. They are going to want it back one day, guaranteeing a negative cash flow at some future date.
We can take two approaches to this information. We can decide that Sainsbury is too much of a bank, and too little of a retailer, for its cash flows to be understandable enough for us to risk investing in the business. That is Pier Analysis's inclination. Or we can notice that in 2019 and 2020 the three measures of cash flow are not very different, and use that as representative of what Sainsbury can do.
Verdict
Having seen what Sainsbury needs to do in the near future to justify its current valuation, and reviewed what it has managed in recent years, we can combine these two analyses.
Pier Analysis's demanding criteria require that Sainsbury has a prospect of delivering cash flow of around £1500m pa. It managed that in 2017, but the average over the last five years has been around two thirds of that. Strip out the volatile financial services cash flows and the figure is below £900m.
On the basis of these figures, the current valuation is higher than is justified by Sainsbury's cash flows. This is the conclusion based on its most recent annual figures, for a financial year that ended in March 2020.
That moment seems a world away now. Sainsbury's interim report shows:
Argos's 570 shops were ordered closed as non-essential retailers. The decision has been taken that 148 of those will never reopen, and that most of the rest will close over the coming years, with collection of goods moving to Sainsbury outlets.
The confinement resulting from the virus has driven sales up by 17% at the half way mark, with online sales up 117%. Recall that this is a company that in recent times has only grown more than a couple of percent when it acquires something.
As a result the company has "chosen to pay a special dividend in lieu of a final dividend for the 2019/20 financial year". Positioning it as a special dividend rather than a routine one is perhaps consistent with an understandable caution that the improvements may be pandemic-induced rather than of a more permanent character.
Cash flow has risen sharply, and is now at the levels demanded by the analysis of future required cash flow above. However, much of that improvement is the result of Sainsbury Bank customers paying off their loans and the whole financial services business contracting.
News reports suggest that the company's new CEO is minded to sell the bank, mainly for want of profitability in today's low interest environment. A more compelling reason to want to sell it is that it would leave a simpler, more valuable business. We have no idea how much the bank is worth; probably not a lot if the reason for selling it is that it makes no profits; but the appeal of its parent would be transformed if further news emerged that it had fetched anything usefully larger than book value.
For Pier Analysis, the decision to invest in Sainsbury comes down to forming one’s own view about two things.
Will at least some of the pandemic-induced lift to cash flow prove permanent?
Has the firm at last gained the appetite to get out of financial services, and realise a business that is simpler to manage, finance and understand?
What next?
A distinctive feature of Pier Review is that it provides the financial model that underpins each analysis.
Pier Analysis’s insistence that companies are capable of generating enough cash to repay their debt and current equity values within 15 years, and deliver a return of 10% on top of that, is more demanding than the norm. Intentionally so. If you would settle for a lower return, or are willing to wait more patiently for the recovery of any investment, you can use the model to examine the effects of these different requirements. Or you can see how the direct cash flow is built up from the indirect one provided in the accounts, and trace the components right back to the original figures.
To receive the spreadsheet
if you have not done so already, subscribe to Pier Review by using the box below
click here to pre-populate a message in your usual email program requesting that the spreadsheet be sent to you
switch to your email program and click Send to despatch the request.
If you find this analysis interesting, you can sign up to have others like it delivered to your inbox several times a month.
Share Pier Review with interested friends.
Notes
[1] For support for the notion that enterprise cash flow and enterprise value are not meaningful concepts in the context of banks, see this helpful article.