

Marks and Spencer
Marks and Spencer
Most data sources ignore an accounting change. It makes a big difference.
Marks and Spencer has been costly to Pier Analysis.
It has been time consuming to analyse, so much so that this article is a month later than intended.
About two years ago, Pier Analysis acted on a judgement that M&S’s known weaknesses were more than reflected in its share price. Since then, the share price has fallen by two thirds.
Established in 1884, M&S now operates 1500 stores, most of them in the UK. It sells food, which is well regarded, and clothing, which is not. It claims it “continues to be the UK’s largest clothing retailer … closely followed by Next and Primark.”
It is widely perceived as being symbolic of the changes under way in retailing. Twenty five years ago the owners of a shopping centre would consider it a triumph to win M&S as their anchor tenant. Their bankers would agree. Now, both groups look nervously as their exposure to a counterparty that seems unable to find any way to reverse a decline in perceived relevance.
Shares that were over £6 in 1998 are under £1.40 now. Relative to the boundary between prime and non-prime, which is a euphemism for junk, some credit rating agencies place M&S's debt just a notch or two above. Other agencies put it just below. The 2020 annual report uses the term “secure the future of the business” four times, as if acknowledging that any future is not a given.
That a company is doing well does not necessarily make it a good investment. The notion that it is doing well may be widespread, but not substantiated by a careful reading of the accounts. Even if it is doing well, it is possible that its good qualities are more than recognised in the share price. Many of the now fashionable technology companies meet this description. The same thing is true in reverse. We need to check whether M&S is doing as badly as is commonly supposed, and whether the share price already allows for any weaknesses.
Easy to be misled
M&S’s enterprise cash flow averaged over £500m between 2016 and 2020. These are financial years ending in March, so Covid will not have had much time to affect the 2020 numbers [1]. The cash flows have been adjusted to remove items that are unlikely to recur, to get some sense of the business's underlying ability to generate cash.
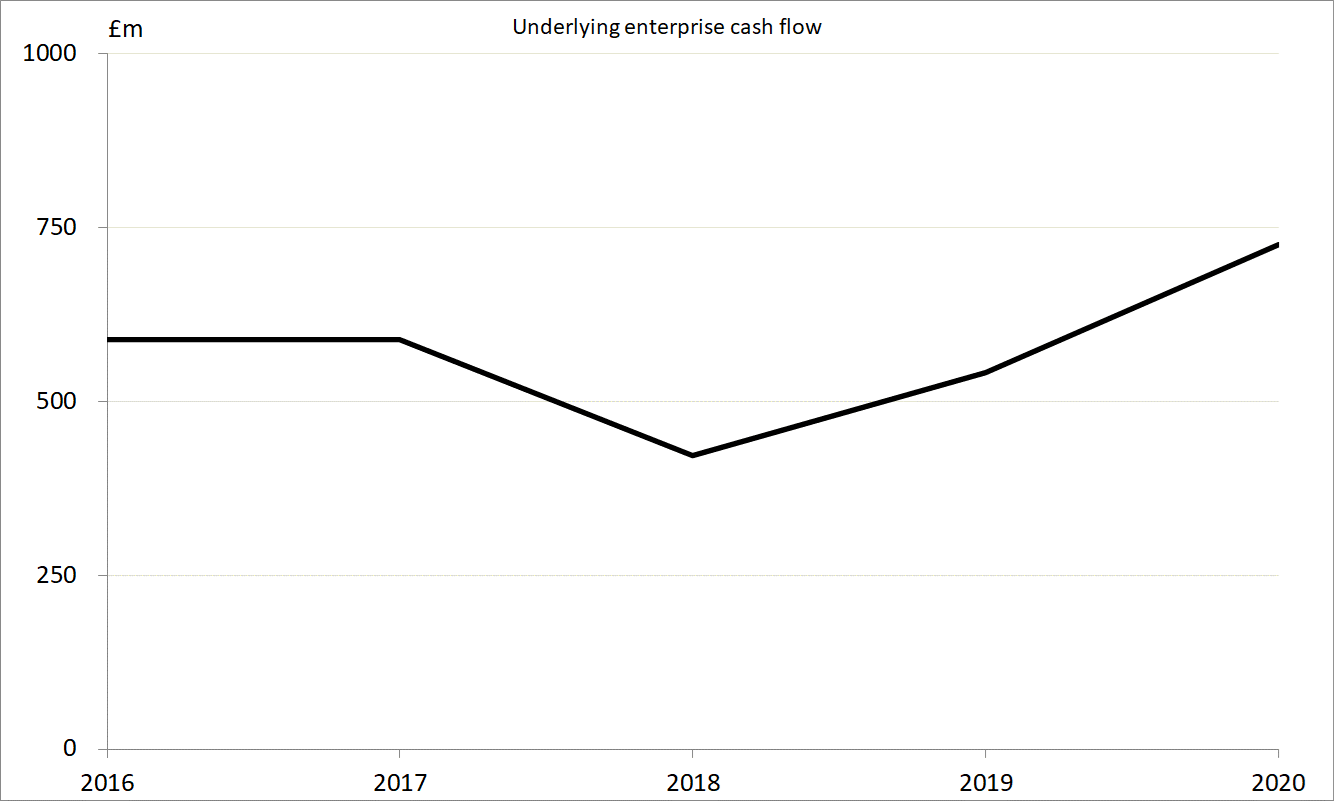
But this is an illusion. The cash flows represent revenues less operating and capital costs and taxes; and among those operating costs is rent. M&S leases most of its stores, and so pays a good deal of rent. Except, in 2020, it paid none at all.
The change is not particularly easy to see. Most companies show their revenues and costs in the first few lines of their income statement. Since 2018 M&S has chosen to make no mention of its costs in its financial statements, though it did so before. The income statement jumps straight from revenue to operating income, with no intervening steps. Details of the costs are relegated to note 3 of the accounts. You have to compare that note to the 2020 accounts with the equivalent to the 2019 accounts [2] to see that occupancy costs fell by not far short of half, from £652m to £378m, a drop of over a quarter of a billion pounds.
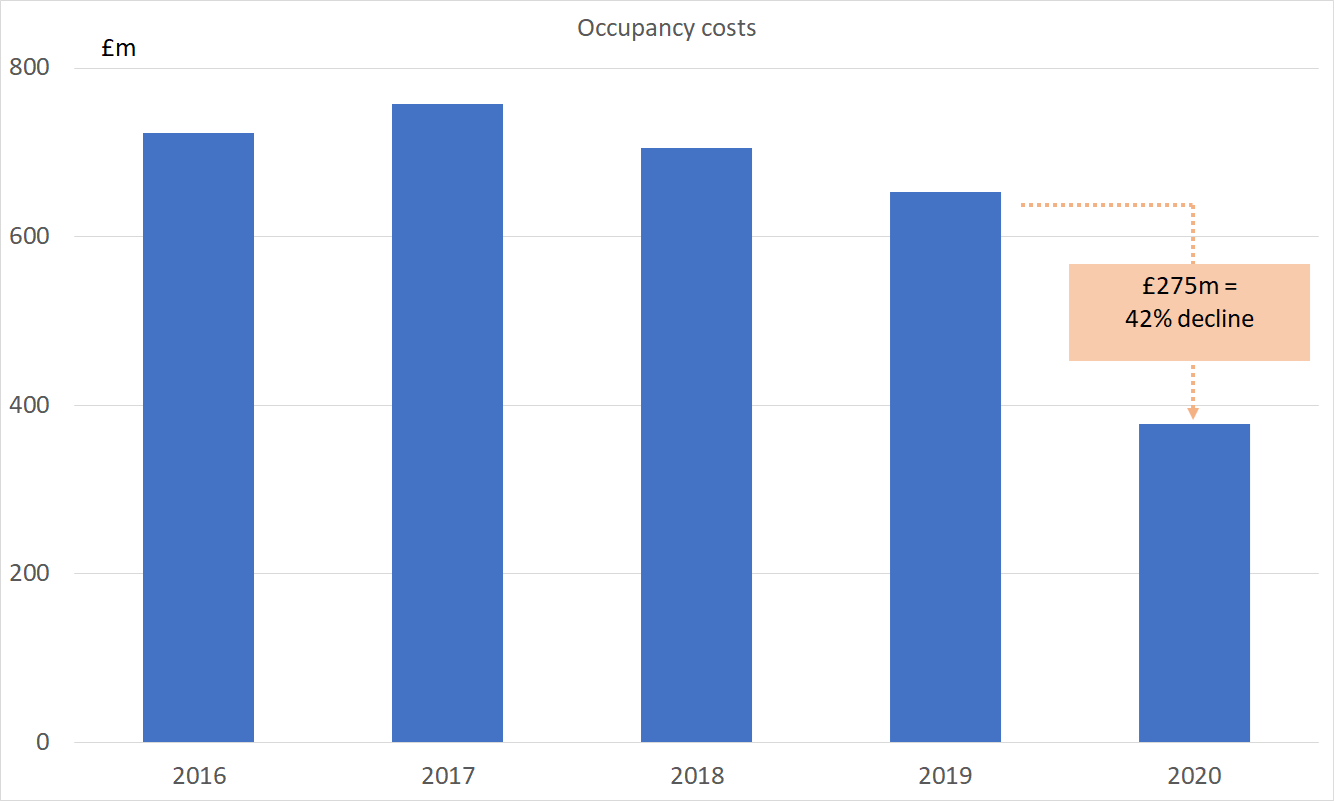
The drop is due to the elimination of rent. What is reported as occupancy costs is confined to business rates (local property taxes), service charges, and such things as cleaning, heating and lighting.
Of course, it's not the case that M&S's obligation to make rent has suddenly evaporated, or that it has wilfully withheld payment.
What has happened is that the accounting standard concerning operating leases has changed. The topic is dry and technical, but it is worth persisting with, because for M&S the liabilities it has acquired under leases, which include all the stores, warehouses and offices that it rents rather than owns, are at the heart of its story.
The old method of accounting was called IAS (International Accounting Standard) 17. Under those rules, payments of rent were recorded simply as an operating cost.
The new approach is called IFRS (International Financial Reporting Standards) 16. Now rent is excluded from operating costs. Instead, payments are represented further down the cash flow statement among the financing cash flows, where they are shown as the payment of interest on, and the repayment of principle of, the associated lease liability.
Pier Analysis focuses on what it calls enterprise cash flow, and many call free cash flow. It is a measure of what is available for sharing among a business's various providers of financing. For that reason it is calculated after deducting operating costs but before deducting financing costs. The new rules will see it rise. Affected in exactly the same way is EBITDA, a measure that Pier Analysis despises but is nevertheless widely popular. All the online data feeds and stock screeners that Pier Analysis checked neglect this detail and reported unadjusted, ie inconsistent and therefore misleading, numbers.
Since the cash flows related to the servicing of leases are now thought of as financing cash flows, those leases need to be thought of as part of the company’s financing. The debt will rise because the leases are now counted as part of it, maintaining, at least approximately, a consistency with the rise in the cash flow resulting from the exclusion of the rent payments.
Slightly complicating this picture is what happens when M&S moves into a new property. Buying the building outright would be recognised as a capital expenditure, which would certainly depress the enterprise cash flow. If, alternatively, the company agreed to rent the building rather than buy it, then under the old rules nothing would be recorded in the accounts because no money changes hands at that moment. This difference in treatment is hard to rationalise when one considers that the business is just as much on the hook for all the obligations that come with occupying a building in both cases. The new rules therefore call for the right to use the property, and the obligation to pay for it, to be recorded in the accounts at the moment of lease signature. Though no cash actually flows at this point, for the treatment described so far to be consistent, we have to adjust the cash flows reported in the accounts, recording a notional capital expenditure as an outflow from the enterprise cash flow, offset by a notional inflow to the financing cash flow from the taking on of the lease finance .
The effect of these changes is to make agreeing to rent a property under a lease look very much like buying it and financing it through a mortgage. While the old standards saw enterprise cash flow depressed by a bit by each year’s rent payment, the new one sees it depressed by a lot by the initial commitment to occupy the space, and by nothing thereafter.
This topic has been brewing throughout this year, as IFRS 16 came into effect for reporting periods beginning after the start of 2019, and so makes its effects felt in the 2020 accounts. It has caused the reported debt of many companies to rise, as lease liabilities start to be included. This is true even for companies that have strongly positive cash flows and are using it to pay down debt.
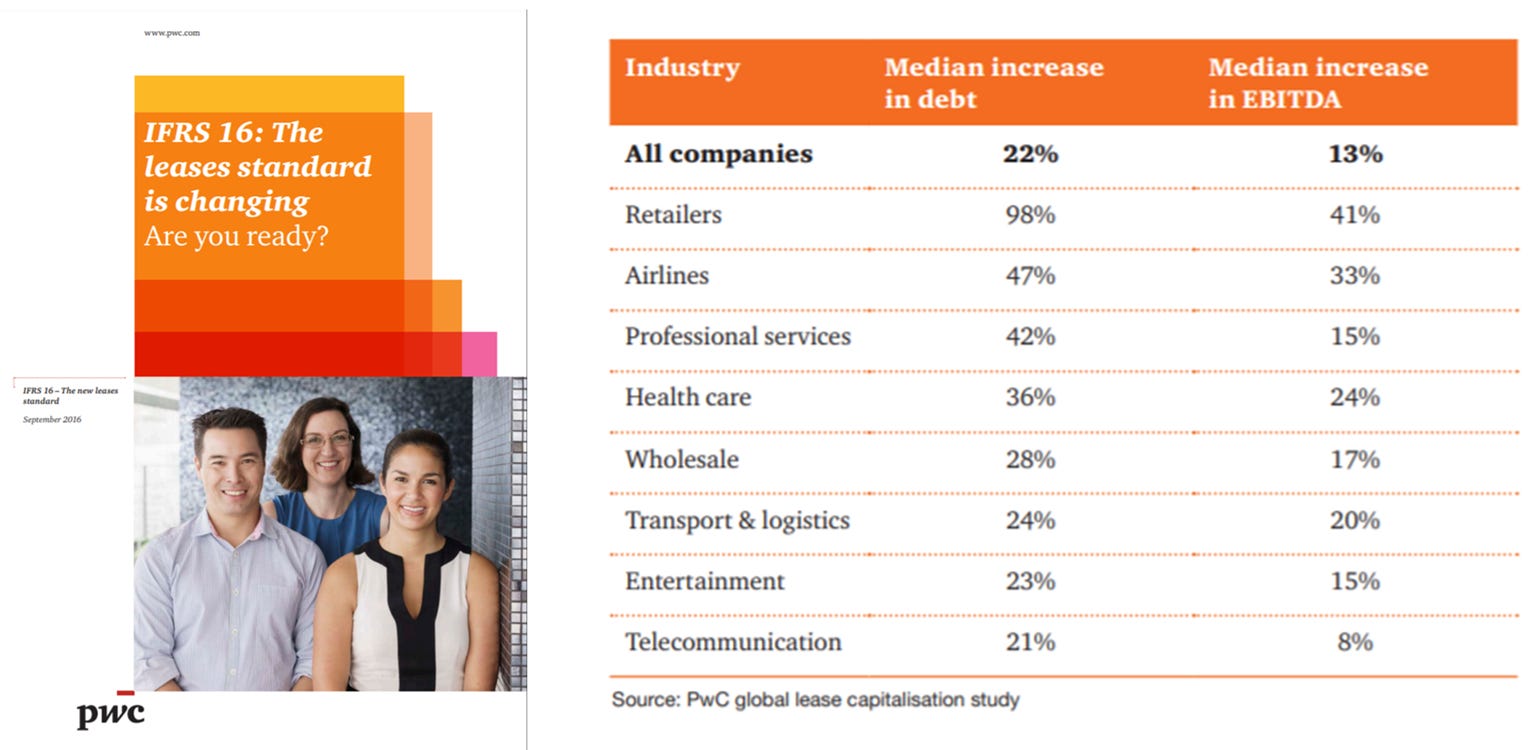
Marks and Spencer is the first company we have covered where the change makes a big difference, because its lease liabilities are particularly large compared with its current valuation. PwC reckons that the change will cause a doubling of the debt of retailers in the median case.
There are two ways to make the adjustment. We can either use the old rules, which means altering 2020 so that it is like previous years. Or we can use the new rules, which means altering earlier years so that they are like 2020. The first approach is easier to accomplish. There is only one year to alter, and annual reports give ample comparative data about the effect of the change as we transition from one regime to the other. Altering the historic years is much harder, because the reports of those years gave limited data about the numbers behind the leases. However, as the years pass, we will move from having just one year under the new rules, to having the majority of recent years following them, and we won’t get any comparative information to help us translate them back to the old format. Sticking to the old rules demands adjusting every future year. Switching now to the new rules involves making one-off adjustments to past years, and then leaving future years alone.
In the cash flows that follow, Pier Analysis has adjusted the figures in prior years so that they are consistent with the ones shown for 2019 and 2020. To summarise those adjustments:
All leases are included in net debt
The rent arising from those leases is no longer shown among operating costs. It therefore does not depress enterprise cash flow.
Instead, rent payments are represented as the payment of interest and principal on the leases, shown under the heading junior debt. In this way they depress the financing cash flows.
When new leases are signed, the value of the leased asset is shown as a capital cost, offset by the cash inflow from the new borrowings. Though the combined effect is neutral, the enterprise cash flow will be depressed and the financing cash flow will be elevated. This treatment is equivalent to applying the same treatment to renting a building as to buying it on a mortgage.
Some of the adjustments can be found in the accounts. Others have had to be estimated. A distinctive feature of Pier Analysis is its willingness to share the financial model that underpins its analysis. The model for M&S shows the derivation of these estimates and the application of the adjustments.
The effect of these adjustments is to show that M&S's cash flow has undergone an unpleasant decline when viewed on a consistent basis.

Enterprise value
Including these newly recognised lease liabilities, M&S's debt amounts to £4,183m. It is offset by £248m of cash, which is enough to cover just ten days of costs. Combined, these make for net debt of £3,934m. This information is gathered by selecting relevant headings from the balance sheet.
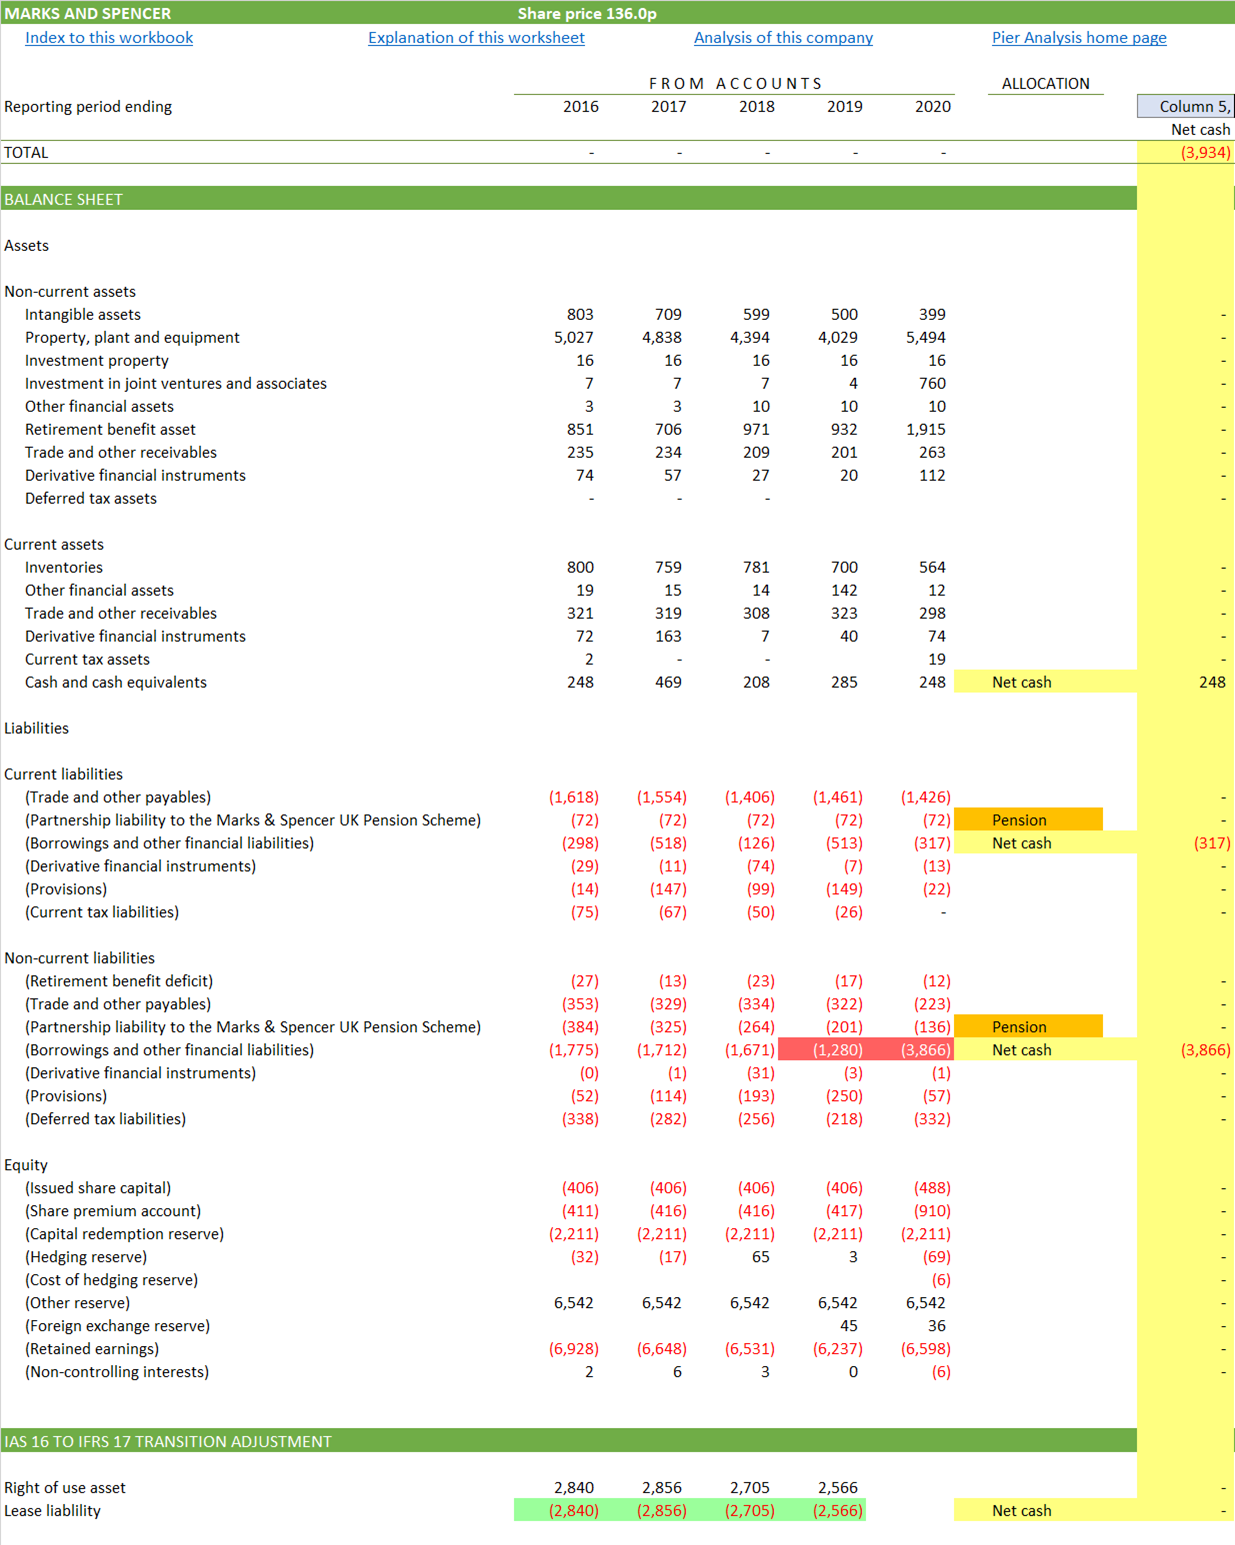
Highlighted in yellow: The £3,934m of net debt.
Highlighted in red: The increase in debt arising from the reclassification of lease liabilities is clear to see.
Highlighted in green: Pier Analysis has applied estimated adjusting entries to past years to make them approximately consistent with the revised treament.
Highlighted in orange: There is also a pension deficit of £207m, which Pier Analysis chooses to treat as further debt.
At the share price of 135.95p on 31 Dec 2020, the market capitalisation of the company's equity is £2,660m.
Together, these items give us an enterprise value of £6,802m.

Required cash flow
Just as a bank will only offer a loan to a borrower that it thinks capable of paying it back, so rational investors will place their funds only with companies that they expect to be able to return the funds eventually. Banks want repayment within anywhere between 1 and 30 years. Pier Analysis encourages shareholders to have a similarly limited time horizon, though that's not the norm. The way business schools teach corporate finance is equivalent to encouraging shareholders to leave their money in their businesses for ever. Pier Analysis's more demanding requirement makes for more conservative investment decisions. Our articles standardise on requiring return of any investment within 15 years, and a return on that investment of 10% pa while we wait.
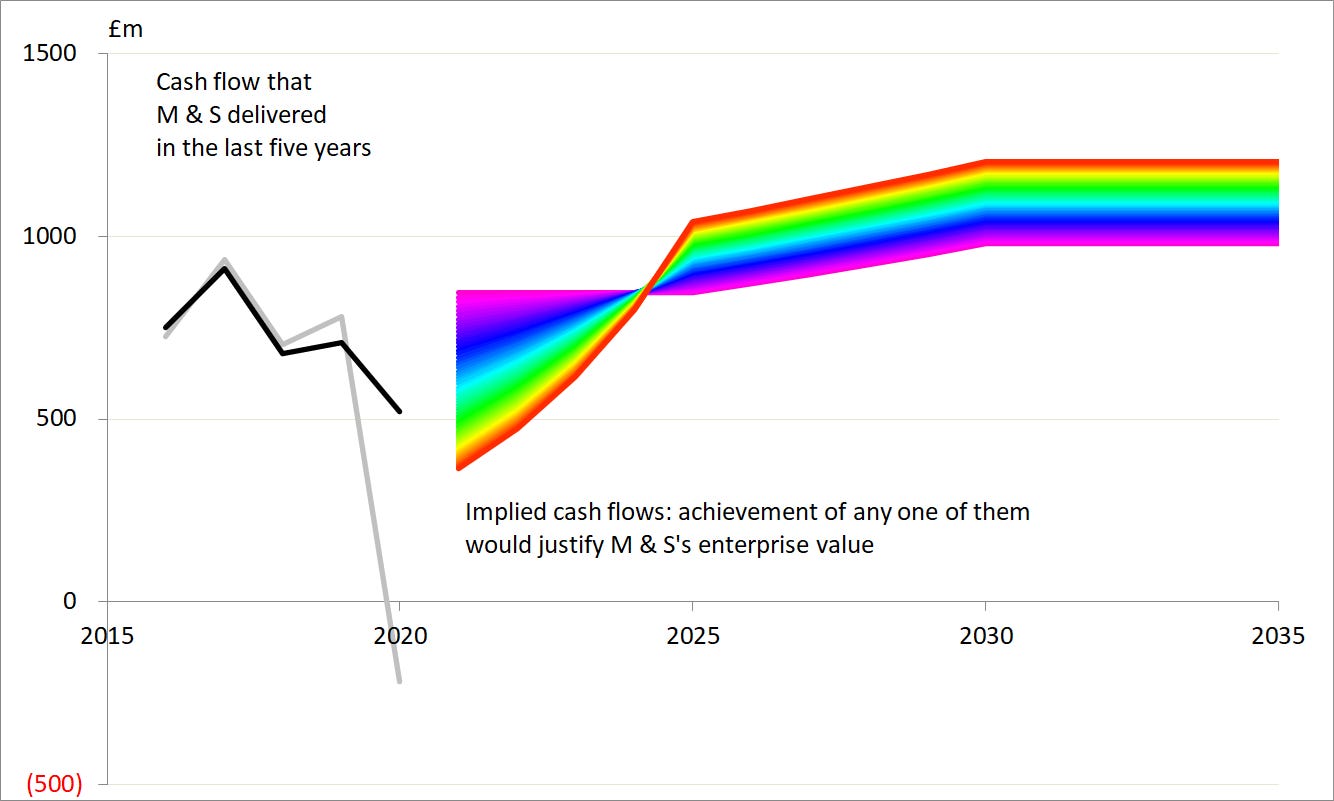
An investment in M&S would be justified if we were confident that the company could generate £845m of cash flow, and that figure rose just a little over time to £980m. This is the violet line on the chart below.
Equally, an investment in M&S would be justified if the company could be relied upon to generate cash flow that started lower, at £364m, but rose more quickly to reach a higher plateau of £1,206m. This is the red line on the chart. There are countless other possibilities between and beyond these extremes.
Enterprise cash flow
It is against these hopes for the future that we can compare M&S's actual recent cash flow.
The black line shows the cash flows we have already graphed, the enterprise cash flow after adjusting for the introduction of IFRS 16 and to eliminate non-recurring items.
The grey line shows those same cash flows, with the IFRS adjustments, and with the inclusion of the non-recurring items.
We can understand how these cash flows are built up, and how they have evolved, by looking at a cash flow statement. It is laid out in the direct format, starting with revenue, and deducting cash costs until one arrives at what is left for shareholders, or retained in the bank. Pier Analysis insists that this layout is more intuitive and insightful than the indirect presentation favoured by accountants and offered up in the annual report.
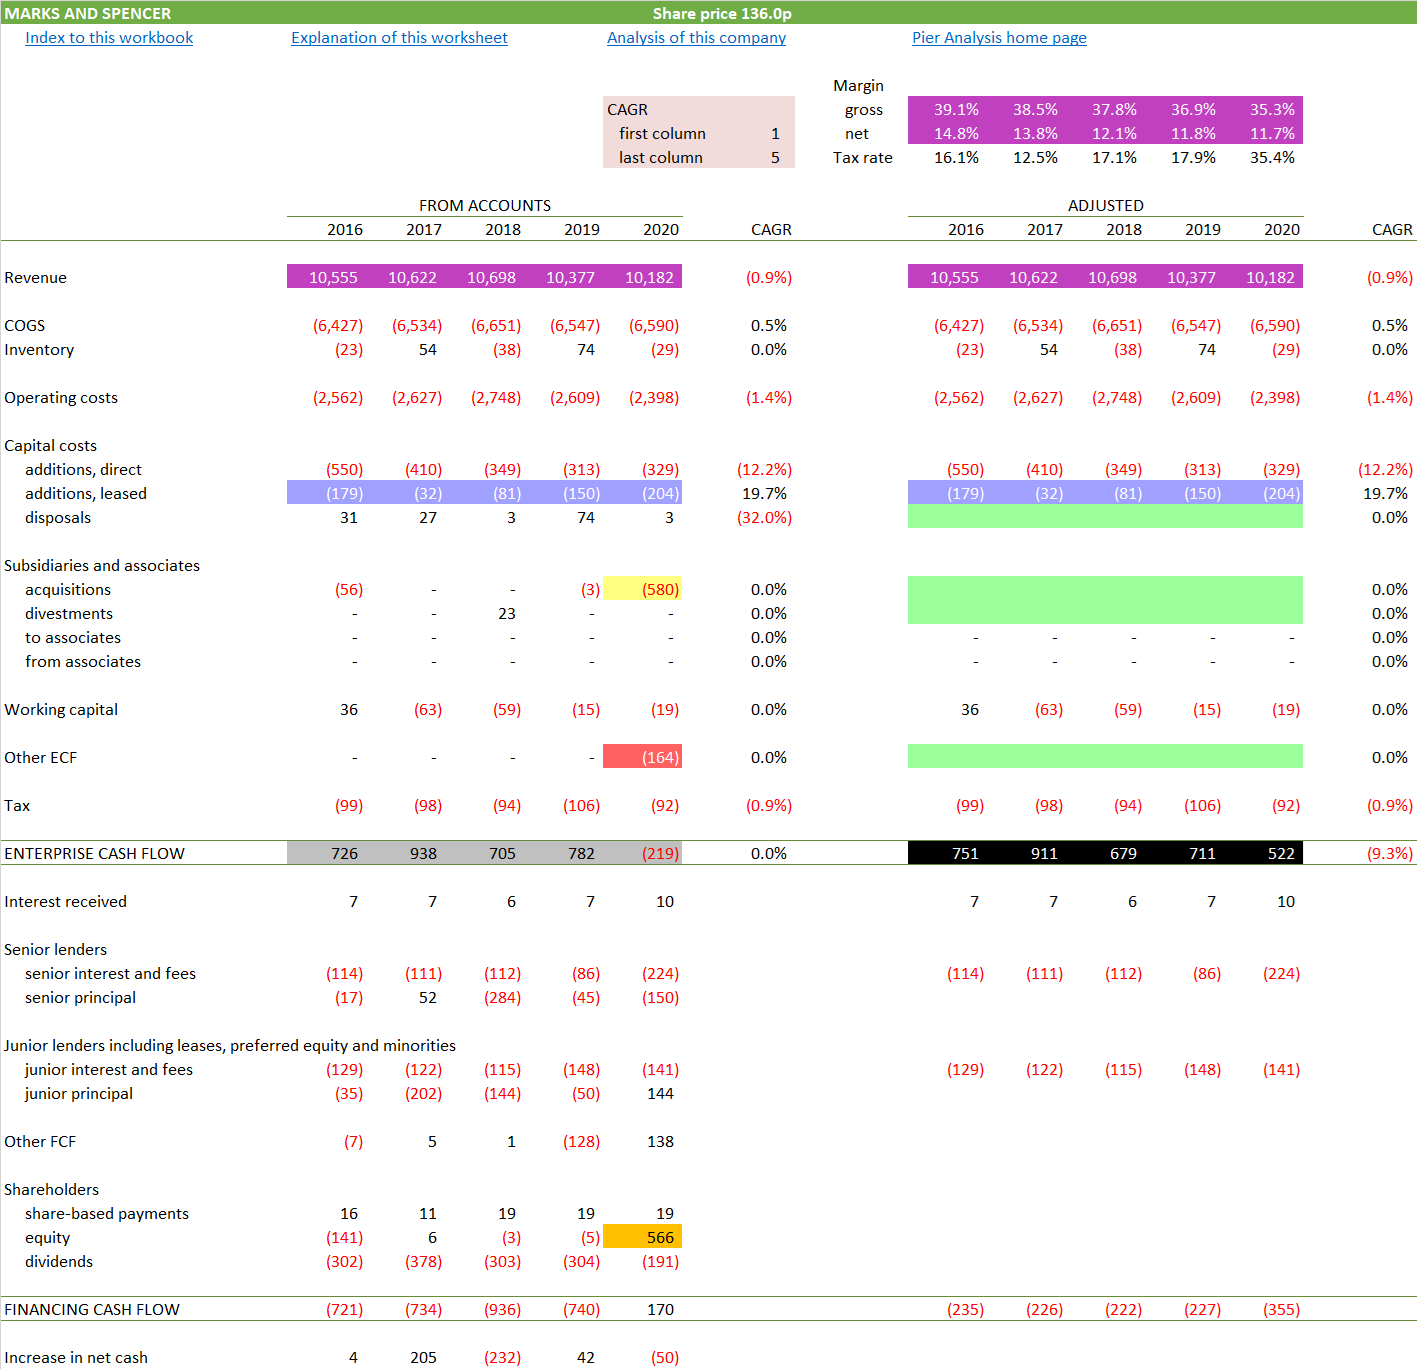
Highlighted in grey: M&S has routinely generated over three quarters of a billion of cash flow in recent years, but cash generation came to a sudden stop in 2020. These are the values represented by the grey line in the graph above.
Highlighted in yellow: The main reason for the reduction in cash flow was the acquisition of a large interest in Ocado, a food delivery business which M&S hopes will propel it from lagging behind the pack to leading it in online sales. Just £580m is shown here, but M&S will have to pay more in future years; it agreed to pay a further £202m of “contingent consideration … conditional on reaching agreed earnings and capacity targets”.
Highlighted in orange: The acquisition of the interest in Ocado was paid for by shareholders through a rights issue.
Highlighted in red: The second reason for the cash flow reduction was £164m of costs associated with the handling of Covid. The nationwide lockdown was announced on 16 March, which means it overlapped M&S’s 2020 financial year by just two weeks. It is surprising that that was time enough for costs to appear on that scale [1].
Highlighted in green. These items are excluded from the adjusted version of the cash flow on the right side of the schedule, as they are not expected to recur and we are trying to discern the underlying capacity to generate cash undisturbed by such one-offs. M&S’s accounts are riddled with adjusting entries that it insists are transitional or otherwise one-off, but it makes such a habit of classifying costs this way that we’ve ignored all but the ones addressing Covid.
Highlighted in black: The adjusted cash flow that results is not as horrible as the unadjusted numbers, but it is still clearly dropping. These are the values represented by the black line in the graph above, and shown in the chart headed "Underlying enterprise cash flow, adjusted for IFRS 16"
Highlighted in purple: Revenues are dropping. So are cash margins.
Highlighted in blue: As discussed, rent is no longer recognised in the operating costs, but the taking on of new leases is recognised as a form of capital expenditure. That M&S reports this figure at £204m does not mean it has taken on that much new property. A large part of it could relate to long established sites where leases have expired at the end of their agreed term and been renewed.
Also visible at the bottom of the cash flow is the drying up of dividends. Only the interim was paid in the year ending in 2020. “The Board has announced the decision not to pay a final dividend for 2019/20 and that it does not anticipate paying a dividend for the 2020/21 financial year.”
Verdict
At today's depressed valuation, all you have to believe is that M&S can get back to the performance of a couple of years ago. If you believe that the last two years were a wobble, that 2021 will be Covid affected, but that business will be back to normal thereafter, the shares are attractively priced.
If, alternatively, you believe that M&S is, in those of its outlets that sell clothes, in effect a chain of small department stores, in the process of being put to death by Amazon and by retailers specialising in each of the areas that M&S covers, then the company is effectively already worthless, since such value as exists in its remaining cash flows is largely attributable to its lenders, and what remains for shareholders is confined to option value.
In making that evaluation, one has to weigh what is good about M&S.
It sells the best food, better than Waitrose in spite of the latter's claims of leadership and higher prices.
It is led by Archie Norman, who has already shown he can turn around a struggling supermarket chain by rescuing Asda and selling it to Walmart,
It has fixed its lateness in doing anything convincing about e-commerce and home delivery by buying its way into Ocado.
It has had the persistence and courage of its convictions to push through this bold strategy in the face of scepticism from institutional shareholders
Ocado’s chairman Sir Stuart Rose was previously M&S’s chief executive. Though he is due to retire soon, his presence likely helped broker the deal and may give rise to a shared understanding of the needs of the two companies.
And then one has to consider what is less favourable.
M&S is in a conflicted situation with Ocado, being both shareholder and supplier. The 2020 annual report observes that “Through Board representation and shareholder voting rights, the Group is currently considered to have significant influence” over Ocado and mentions “the participation of senior members of the Ocado team at [M&S] Board meetings”. Mel Smith was appointed Ocado’s chief executive in September 2019, but remains M&S’s strategy director. . If Ocado wants to make some economy that will boost its profits, but disadvantages M&S, how will those Ocado directors who are appointed by M&S react?
The CFO departed at the end of 2019, resurfacing in a position that is not obviously as prestigious. Reports speculate is that he was forced out because he had not prepared institutional investors either for the principle of acquiring Ocado or for the rights issue as the mechanism chosen to pay for it.
The accounts are opaque. The direct presentation of cash flow that Pier Analysis favours can normally be generated by splicing the income statement to the indirect cash flow presented by most companies. Doing the same things for M&S requires additional rooting about in two notes to the accounts. That the cash flows are presented in this non-obvious way to shareholders makes one wonder with what clarity they are understood by its directors and management.
The company reports a measure of profit of its own devising, and then suggests that the manipulations needed to get to the profit according to recognised accounting standards are "adjusting items". The reasoning is backwards and is never a good sign. The adjusting items are the ones needed to get from the true profit to the manipulated figures that M&S chooses to comfort itself with.
The Chairman's 2020 commentary starts "Although much of this report is about the results for the financial year 2019/20, these now seem to relate to a previous age. The Covid-19 pandemic has since swamped our lives and the way we operate the business." He then spends the rest of his report talking about the impact of the pandemic on trading, neatly evading the requirement to account for the dip in performance last year.
The Chief Executive threatens something similar: "Last year’s results reflect a year of substantial progress and change including the transformative investment in Ocado, outperformance in Food and some green shoots in Clothing in the second half. However, they now seem like ancient history as the trauma of the Covid crisis has galvanised our colleagues to secure the future of the business." He does, though, give two-and-a-half columns out of nine to the results that should be the subject of the report.
These last four points make for a sensation, to readers of the accounts, of a reticence which is not endearing.
Covid
The 2020 annual report is open that the opportunity to profit from seasonal stock will have been and gone during the shutdown, and much will now never be sold.
Like all fashion retailers, one of the biggest challenges arising from the crisis is the backlog of unsold stock for spring/ summer 2020 and the forward pipeline ordered for autumn/winter. We closed 2019/20 with Clothing & Home stock of c.£500m and at that time had committed forward orders of £560m scheduled to arrive in the following six months. As the lockdown eases, a large proportion of current season stock will remain unsold and demand for many categories is likely to be weak. We have acted quickly to improve this position.
We have cancelled late summer stock which will no longer be required, reducing forward commitment at cost by £100m.
Of the balance of stock and forward orders, c.£400m is year-round basic product where M&S trades strongly and which will be carried forward at low risk.
Of the unsold seasonal stock, we have made arrangements to hibernate around £200m until spring 2021, secured storage facilities and planned for the cost of these actions.
Elsewhere the Chief Executive reports
In view of the steep increase in working capital resulting from unsold stocks we are experiencing a cash outflow during the lockdown period and expect to draw on our credit facilities in the months ahead. Under the Covid-19 scenario, drawings are estimated to peak in early autumn at c.£600m, although our current performance would suggest a lower figure.
Formal agreement has been reached with the syndicate of banks providing the £1.1bn revolving credit facility to remove or substantially relax covenant conditions for the tests arising in September 2020, March 2021 and September 2021
Borrowers don’t seek agreements to waive banking covenants unless they are in appreciable danger of breaching them.
Easy to get wrong
Though the cash flow is now shrinking, up to 2018 it had been rising. Had that continued, the firm would have justified the valuation of the time. Pier Analysis judged that, under the new management team, it was plausible that the cash flow growth could continue, and considered the valuation to be an example of popular perception being at variance with the numbers. That is not an extrapolation that has worn well.
Shareholders are entitled to M&S's cash flows only to the extent there are any cash flows remaining after meeting the prior claims of debt providers. At the moment that residue for shareholders is small; while Covid persists, probably negative. The consequence is that quite small changes in M&S's future cash flows will make a disproportionate difference to the value for shareholders. While we can’t see much to be cheerful about at the moment, if any cheerful news came along it could make quite a difference to the share price.
What next?
A distinctive feature of Pier Review is that it provides the financial model that underpins each analysis.
Many current valuations only make sense to those who are content with a return of less than 10%, and willing to wait more than 15 years for the return of their investment. If you are one of those, you can use the model to examine the effects of these less demanding requirements. To receive the spreadsheet
if you have not done so already, subscribe to Pier Review by using the box below
click here to pre-populate a message in your usual email program requesting that the spreadsheet be sent to you
switch to your email program and click Send to despatch the request.
If you find this analysis interesting, you can sign up to have others like it delivered to your inbox several times a month.
Share Pier Review with interested friends.
Notes
[1] Possible counterargument: M&S has a presence in Hong Kong, Singapore and Malaysia, which were affected by Covid earlier than Europe and the Middle East.
[2] The 2020 accounts show comparative figures for 2019, but they have been restated so that they too include no rent. To see the change, one needs to compare the 2020 published accounts with the 2019 published accounts.