


Tesco is to the UK as Walmart is to the US. Both are the largest retailers in their respective countries, accounting for over 20% of supermarket sales, a share almost twice as large as their nearest competitors. Tesco’s domination of its economy is even greater than its American cousin’s, with a much higher market share and many more stores per head of population, largely because Tesco has invested in neighbourhood convenience-sized stores.
If asked to identify the major trends bearing on UK supermarkets, most writers would identify one or more of
the Covid-induced need to switch almost overnight from supplying a fraction of the nation’s nutrition, the rest being consumed in factory and office canteens, sandwich shops, restaurants and so on, to providing essentially all of it
the arrival of the German discount retailers, Aldi and Lidl, with an offer different from the ones previously presented to the British customer: small stores with a limited selection of off-brand items at much lower than usual prices
Amazon’s entry into the market
the move to online delivery
the surplus of space resulting from investment of twenty years ago in large out of town shopping centres which have turned out to be a poor match to modern shopping habits.
For Pier Analysis, the question of whether Tesco makes an attractive investment turns on a topic not on this list: banking. What has banking got to do with investing in Tesco? Two things
Pier Analysis won’t invest in banks
A significant part of Tesco’s cash flows are contributed by Tesco Bank.
Don’t invest in banks
The purpose of Pier Analysis is to bring to the contemplation of quoted companies the outlook of specialists in the financing of infrastructure assets, in the belief that they apply distinctive and valuable thought processes. Chief among those is a purposeful linkage between valuation and cash flow.
Banks don’t fit well into the intentionally simple mental model of cash flows that Pier Analysis promotes.
If Tesco sells £100 of groceries which it bought for £90, the benefit to its cash flow is clear: it is £10. But if someone deposits £10 in Tesco Bank, what effect does that have on the cash flow? To be sure, Tesco can lend that £10 to someone else, and earn interest and fees as a result. But in isolation, separate from that on-lending opportunity, what effect does the deposit of £10 have? It certainly is not revenue, since the bank will have to give it back to the account holder in due course. It is more akin to working capital, since it will unwind one day when the depositor asks for the money to be returned.
Rather than leaving cash in a bank, some account holders may store their wealth by leaving gold bars in a bank’s vault. That clearly has no effect on the bank’s cash flow at all. If that is true of deposits of gold, is it not also true of deposits of cash?
It is not that there are no answers to these questions or that they are conceptually difficult. There are individuals who make their living thinking about banks and how to account for them, to whom these topics would be childishly straightforward. None of their expertise is shared by the Pier Analysis team; and nor, in all likelihood, is it shared by readers of this newsletter. If you can’t easily articulate what effects simple transactions have on the cash flow of a company, or explain what the concept of cash flow even means in the context of a particular industry, you have no business investing in that sector.
Besides being hard to rationalise at the most basic level without specialist skills, banks have two other undesirable characteristics.
Their assets and liabilities are likely to include derivatives and other complex financial instruments, which can change sharply in value. In extreme cases items that are worth +100 this year can be worth -1000 next year. These holdings can only be evaluated with a combination of specialist expertise and access to information about their composition that is not usually public. The 2008-2010 banking crisis showed that not even insiders who had access to both the expertise and the information could understand the risks they were running.
Banks are subject to regulation, which is complex and ever-changing, though admittedly it is likely reducing the risks surrounding complex instruments just mentioned.
All these reasons lead Pier Analysis to simply pass by banks and spend its time on more tractable opportunities.
Tesco Bank
It may come as a surprise to learn that banking forms any part of a supermarket’s operation. Sadly, Tesco is not alone in indulging in this activity. Among UK supermarkets, Sainsbury does the same, and Marks and Spencer did so too until it sold the business in 2004 to HSBC, which continues to operate it under the M&S name. Walmart offers MoneyCard, a prepaid debit card that has grown into the largest programme of its kind in the US, but has had the good sense to outsource its operation.
Though the bank contributes just 3% of Tesco’s profits, it accounts for 18% of its assets and 23% of its liabilities.[1] And, as we will see later, outcomes associated with its banking operations have a material effect on its cash flows.
While Note 1 to Tesco’s 2020 accounts says that “The main activities of the Company … are those of retailing and retail banking”, the annual report is surprisingly quiet about its banking operations.
Page 2 has a chairman’s statement in which the word bank goes unmentioned
Page 3 has the chief executive’s statement. Of 730 words, just 15 are devoted to the bank: as all parts of the business step up to meet the challenges presented by Covid, “Tesco Bank is providing critical services at a time of financial difficulty for many customers.”
Page 5 records “untapped value opportunities” identified in a June 2019 Capital Markets Day. The bank features nowhere among them.
The only remarks that Tesco offers about why it is in the banking business at all are
Tesco Bank focuses on providing simple banking and insurance products to a broad range of Tesco customers.
Services such as Mobile and Banking focus on the needs of Tesco shoppers and allow us to earn and retain their loyalty.
Pages 1 and 4 of the annual report highlight progress through Key Performance Indicators. Footnotes on both pages report that “Free cash flow and total indebtedness exclude the impact of Tesco Bank”. And yet, as we will see, the bank has a very real effect on both of these metrics.
Thankfully, Tesco appears to be extracting itself from this activity. Banking assets were already shrinking as a proportion of sales before 2019. In addition, the annual report advises
On 27 September 2019, the Group completed the sale of the majority of Tesco Bank’s mortgage portfolio to Bank of Scotland, which is part of Lloyds Banking Group.
In February [2020] we stopped accepting new applications for personal current accounts, as part of our repositioning of Tesco Bank to focus on the right products and services for Tesco customers.
These things may incline us to tolerate the banking activities on the grounds that they are small and shrinking. We could find positively attractive the prospect that Tesco might continue on this path, as exiting banking altogether would extend its appeal to investors who like Pier Analysis are repelled by its entanglement in this distraction.
Enterprise value
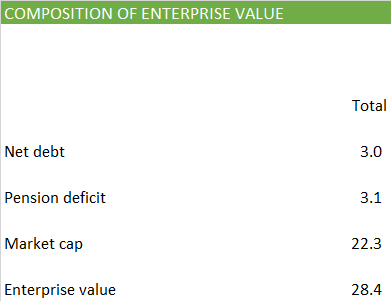
The first step in our analysis is a calculation of Tesco's enterprise value. To do this we look at the balance sheet to see how much debt it has. We find that the answer is £7.5b. Offsetting that is £4.5b of cash and investments. Net, the debt amounts to £3.0b.
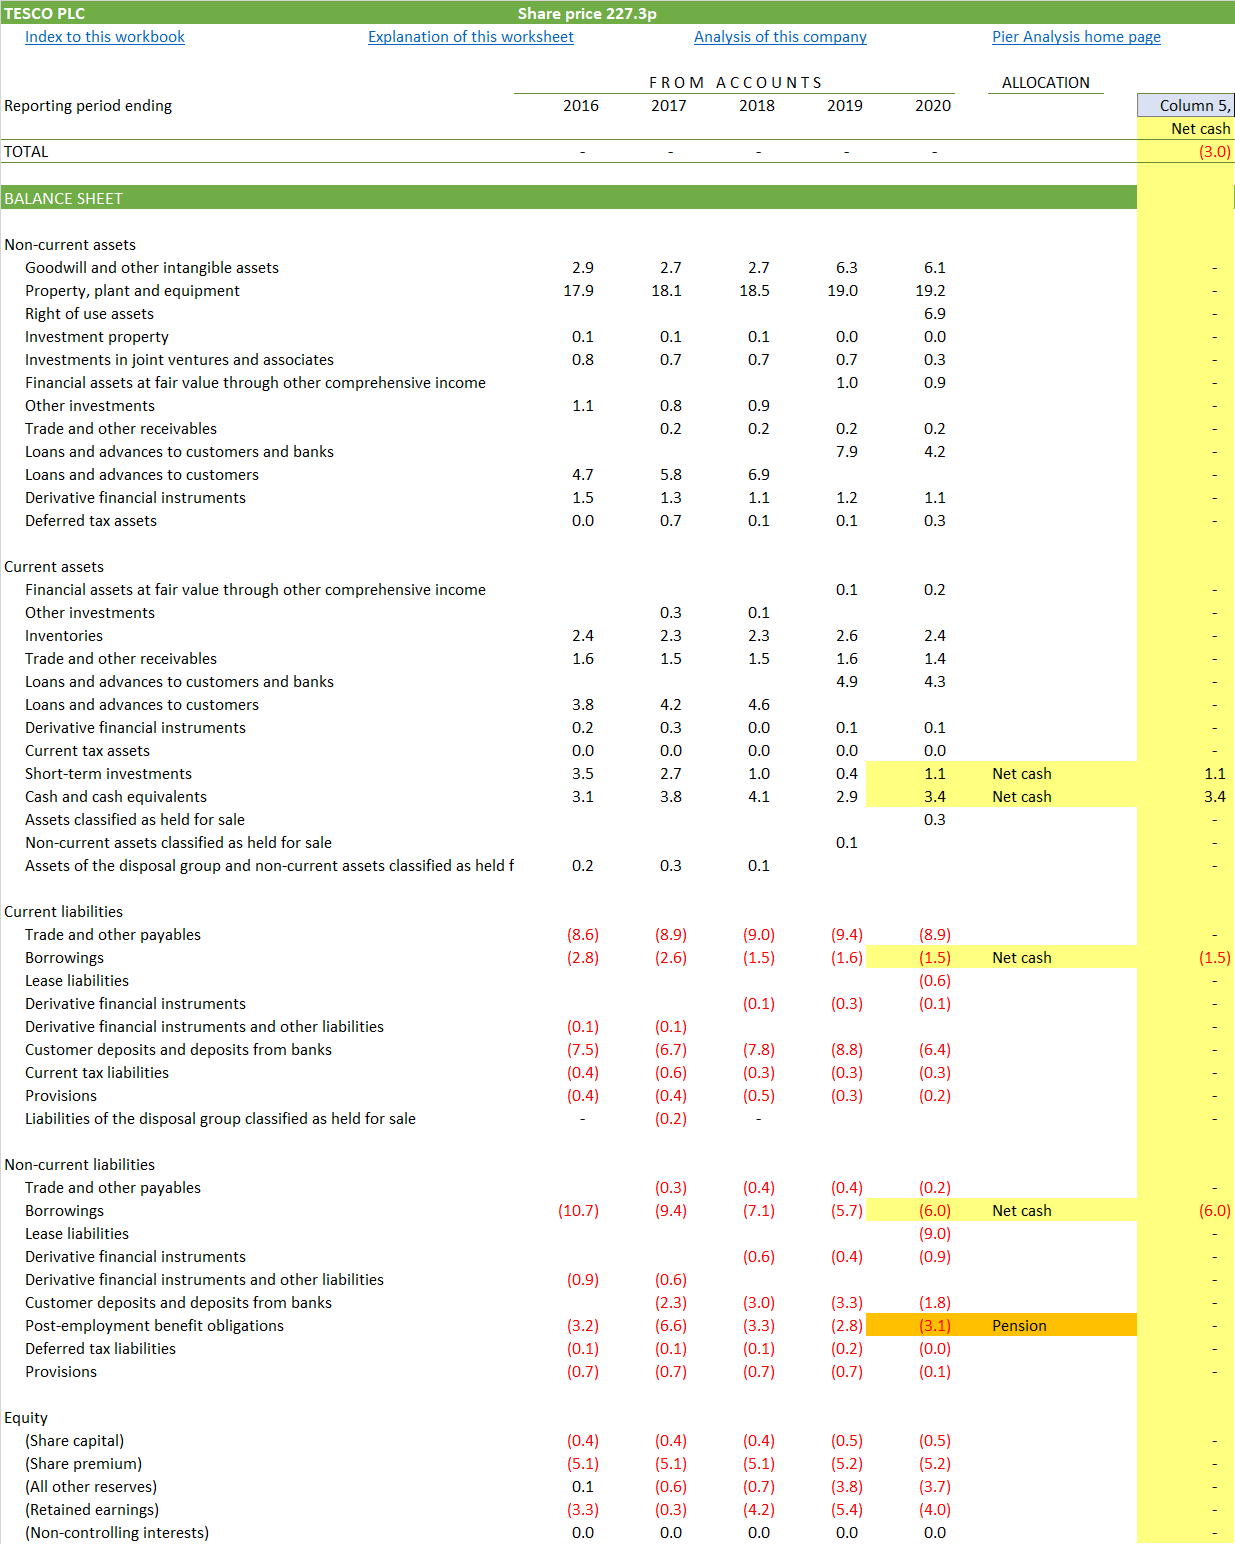
We also extract the liabilities that Tesco has to pay pensions. Conservatively compared with many other analysts, Pier Analysis chooses to treat such liabilities as another form of debt.
We combine these figures with the current market capitalisation of Tesco’s shares, which serves as the value of its equity. Together, we find an enterprise value of £28.4b.
Necessary cash flow
Once we know its enterprise value, we can work out what Tesco needs to accomplish to justify that value [2].
One way is to deliver cash flows around £3.5b to £4.1b: this is the violet line on the graph below.
Another way is to deliver a cash flow that is lower than this range in the early years, say £1.5b, but makes up for that by growing rapidly so that it is significantly higher in the later years, reaching £5.0b. This is the red line on the graph.

And there are infinitely many contours between these two examples, and beyond them. Any one of the cash flow profiles shown would put Tesco in the position to return our investment within 15 years and give us a 10% return while we wait for it.
Cash flow achieved
Now that we have some sense of the cash flows that Tesco needs to generate in order to justify an investment in it, given our chosen time horizon and rate of return, we can look to see whether it is at all likely that it can deliver them, by comparing them with the cash flows that Tesco has delivered in the recent past.
The lines at the left in the graph above show what Tesco’s enterprise cash flow looked like in the last five years. Normally we show two of them. For Tesco we show three
a grey line, which is what the accounts show
a black line, which reflect what the cash flows would be after some necessarily subjective adjustments aimed at stripping out items that are unlikely to recur in the future, in search of a sense of the underlying cash flow that the Tesco can reasonably be expected to generate in the future
a dotted line, which shows yet more adjustments detailed in a moment.
These numbers are taken from Tesco’s cash flow, which Pier Analysis insists on expressing in a direct format. Starting with the firm’s revenues and deducting its costs is much easier to understand than the layout favoured by accountants, which starts with a measure of profit, itself the product of arcane accounting practices, and then applies to it various transformations to bend it into matching the company’s actual cash movements.
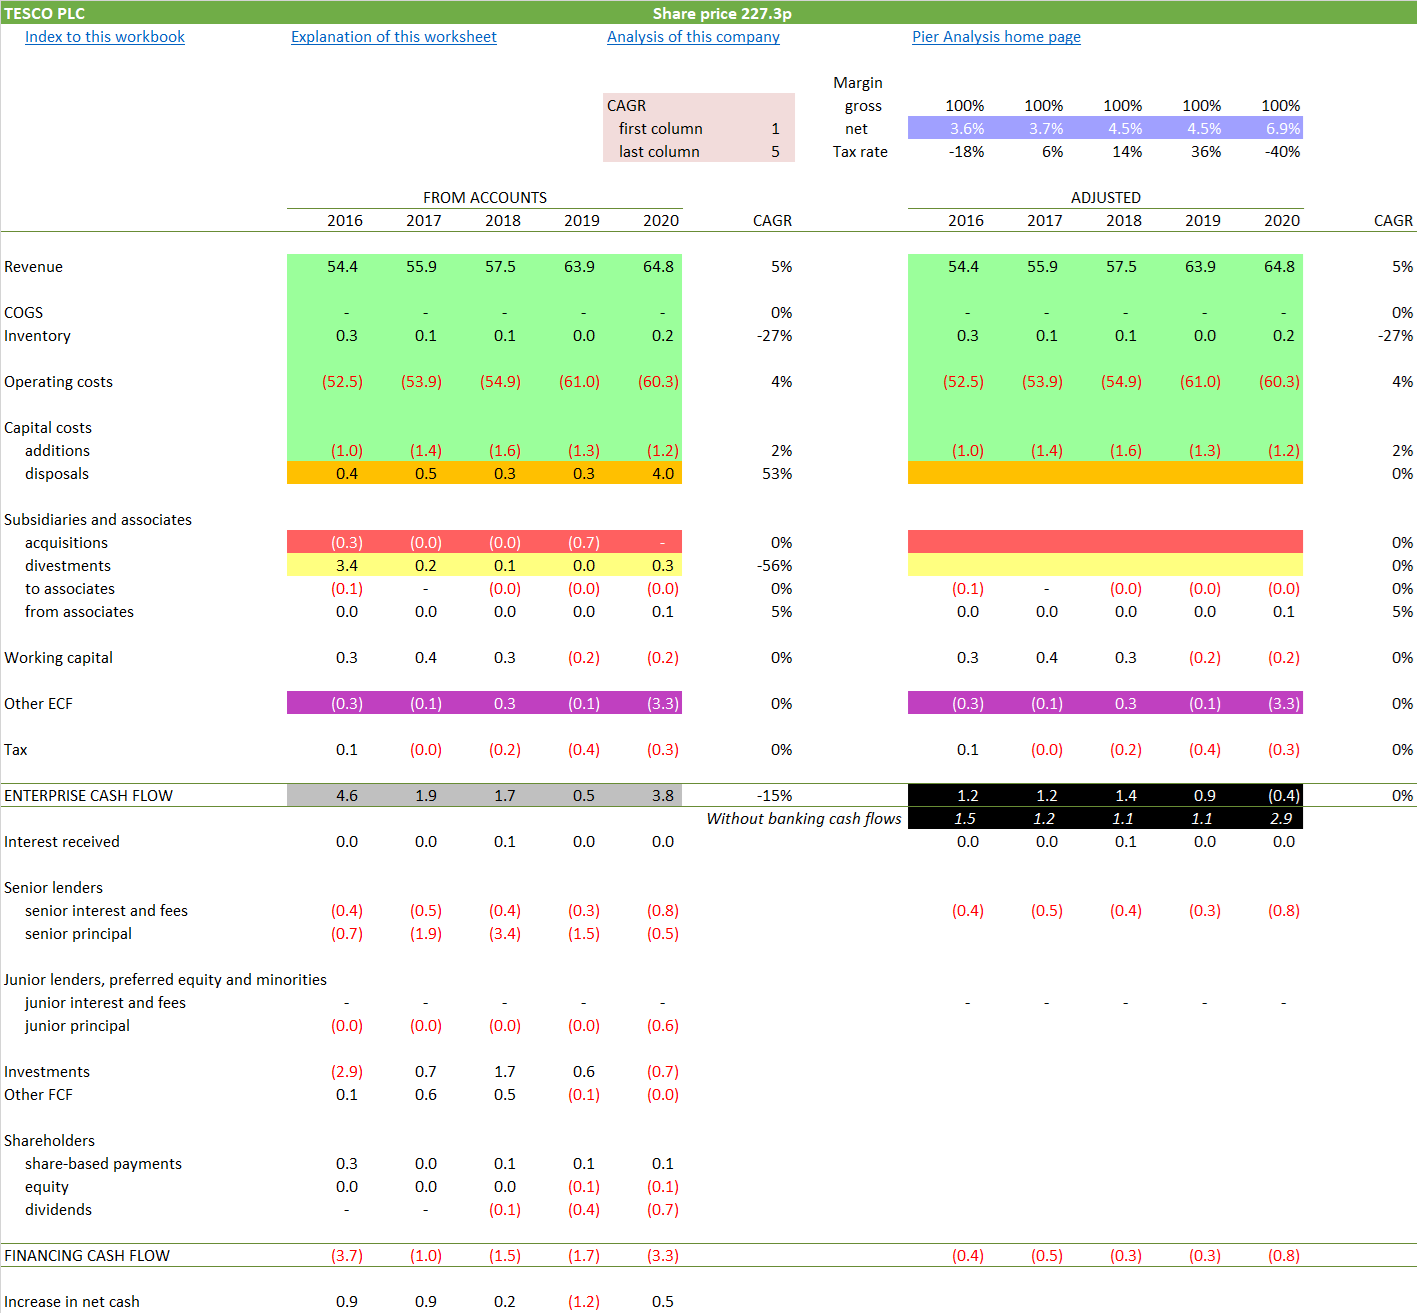
Shaded in grey: The enterprise cash flow represented by the grey line in the chart above.
Shaded in black: Adjusted versions of Tesco’s enterprise cash flow, represented by the black lines in the chart above.
Shaded in green: Tesco’s operations show revenue rising at 5%, cash operating costs at 4% and capital costs at 2%.
Shaded in blue: Because its revenues are growing faster than its costs, Tesco’s cash net margin is growing very nicely.
Shaded in red: Visible among acquisitions are the £0.7b paid in the year ending 2020 to acquire Booker, a wholesaler. This amount is just a fraction of what was paid for the business. Most of it took the form of Tesco shares and so does not pass through the accounts. Also visible on this line is £0.3b paid in 2016 to buy out partnerships through which Tesco owned various properties. All of these acquisitions are removed from the adjusted cash flow, on the grounds that having been made, they do not need to be paid for again.
Shaded in yellow: Visible among business divestments is the £3.4b raised in 2016, mainly from selling operations in Korea. All of the divestments are removed from the adjusted cash flow, since having been made, there is no opportunity for them to recur.
Shaded in orange: Visible among the asset disposals is £4.0b relating to the sale of Tesco Bank’s mortgage portfolio to Bank of Scotland. Those too are removed from the adjusted cash flow since they will not appear in future years.
Shaded in black: Removal of the mortgage portfolio sale has the effect of turning the 2020 enterprise cash flow from £2.9b positive to £0.4b negative.
Shaded in purple: As discussed, our usual direct representation of a company’s cash flow is clear for many businesses, but it does not really fit a bank. There is no obvious line on which to represent deposits or withdrawals made by customers. We have chosen to show them as “Other ECF”, that is, Other Enterprise Cash Flow (there is also a line further down labelled Other FCF, meaning Other Financing Cash Flow). We can see that in 2020 Tesco’s banking operation gave rise to a £3.3b outflow.
Though the annual report is 176 pages long, it devotes less than a quarter of a page to Tesco Bank, and nowhere explains this phenomenon, even though the figure is nearly three times as large as the whole of 2020’s capital expenditure. The nearest it gets is to disclose that customer deposits fell from £10.5b to £7.7b, which is almost certainly the cause of the outflow.
The key question is whether this outflow should be included in our estimation of Tesco’s enterprise cash flow.
We think it should be, since the business has had to give these customers real cash as they withdrew their money from Tesco Bank.
The counterargument is that we are seeking to gauge Tesco’s underlying cash flow, to serve as some guide as to what is plausible in the future. Individuals who have withdrawn cash from Tesco Bank in 2020 will not return in future years to withdraw the same cash. This suggests we should not [3] include these banking flows, just as we should not have included the deposits whenever they were made some years ago.
Tesco itself uses Retail free cash flow, which as the name suggests excludes the banking flows, as an alternative performance measure by which to steer the business.
The subject comes back down to how to think about cash flow in the context of a bank, and whether the concept is even meaningful.
We are left with two versions of enterprise cash flow for the business
the upper of the areas highlighted in black, and shown as a solid line on the chart, in which we include the banking flows
the lower of the areas highlighted in black, and shown as a dotted line on the chart, which excludes the banking flows.
The problem is, we have little idea which one to base decisions on.
Stay away from finance
We end up with a firm full of good news.
Revenues were rising at 5% pa even before the pandemic drove them further upwards
Current conditions have brought the market share gains of the German discounters to a shuddering halt
Margins are rising
All of this is obscured by large and adverse cash flows coming from an opaque banking division in which the firm has so little interest that it says almost nothing about it.
Supermarkets are not the only businesses rendered uninvestible by unfortunate diversifications into finance. Many of the car companies are composed of manufacturing businesses whose apparent profitability results only from an implicit subsidy to the customer from deeply loss making finance arms. If, contrary to our recommendation, investors want exposure to the banking sector, they can get it by investing in dozens of banks directly. They do not need their supermarket to do it for them.
What next?
If you have a view on how to think about the cash flows of banks, within Tesco or outside it, Pier Analysis would very much welcome hearing it. Just hit reply to this email.
A distinctive feature of Pier Review is that it is willing to provide the financial model that underpins each analysis. The images in this article are taken from the model.
Current valuations, particularly of technology stocks, only make sense to those who are content with a return of less than 10%, and willing to wait more than 15 years for the return of their investment. If you are one of those, you can use the model to examine the effects of these less demanding requirements. You will see the coloured lines on the graph, which show the projection of cash flow required to justify the valuation, will shift downwards. (The black lines on the chart will not move, since they are the result of Tesco’s reported historic performance.)
To receive the spreadsheet
if you have not done so already, subscribe to Pier Review by using the box below
click here to pre-populate a message in your usual email program requesting that the spreadsheet be sent to you
switch to your email program and click Send to despatch the request.
If you find this analysis interesting, you can sign up to have others like it delivered to your inbox several times a month.
Share Pier Review with interested friends.
Notes
[1] In calculating these percentages we have assumed that all derivative assets and liabilities are associated with the banking operation.
[2] Pier Analysis takes the view that a viable destination for cash available for investment is any of many funds that specialise in owning infrastructure assets such as hospitals, schools, power stations and renewable assets. These assets often exhibit very dependable cash flows as a result of having national and local governments as their customers. They typically have lives of 30 years, and the average asset held by a fund will be halfway through this life and so have fifteen years to go. The returns promised by these funds when they launch is typically in the range of 8-11%. Pier Analysis therefore seeks to match this alternative by seeking a return of 10% pa and requiring it to be delivered over a fifteen year period.
[3] This article was edited on 2 December 2020 to insert an omitted “not” that inverted the intended sense of the sentence.