
FedEx
Making Royal Mail and DX look good value
Having looked at two UK based delivery businesses, Royal Mail and DX, Pier Review turns its attention across the Atlantic, where what used to be Federal Express, and is now known as FedEx, has seen its share price double since the mid March.

The reasoning seems to be that
volumes will rise as more retail moves online
these greater volumes can be handled without a proportionate increase in costs
the widening margins will cause cash to cascade to the bottom line.
Let's have a look and see how plausible this investment thesis is.
Enterprise value
What its shareholders have at stake is measured by FedEx's market capitalisation, now standing at $52b. That's over 20 times bigger than Royal Mail. A couple of the larger planes in FedEx's fleet will be more valuable than DX in its entirety.
FedEx Express operates the world's largest cargo air fleet with more than 650 aircraft, and is the largest operator of the Airbus A300, ATR 42, Cessna 208, McDonnell Douglas DC-10/MD-10, and the McDonnell Douglas MD-11. [1]
Combine FedEx's $52b market capitalisation with what it owes its lenders, and what it owes its former employees in the form of a non-trivial pension deficit, and the amount that all these parties have at stake amounts to $75b.

Required performance
Our first instinct when we see this figure is to hope that FedEx is generating cash flows of around $7.5b each year. This is because we would want this enterprise value to be rewarded at something close 10% pa. [2]. Actually, we'd like the cash flow to be rather higher, because as well as delivering this return on our investment, we'd like FedEx also to give us a return of our investment over a suitable period of time. [3].
There are several ways FedEx could do this. It could generate $9b a year, rising gently to $11b; this is the violet line on the graph below. Or it could generate less in the near term, so long as it did better as time went by so that the cash flow climbed to a higher figure in the long run to compensate; this is the red line on the graph. Any of the paths in between would do, as would a myriad of others. [4]

Actual performance
The lines on the left of the graph compare these hopes for the future, implied by the current valuation, with what FedEx has actually accomplished in recent years. The grey line is what is shown by analysis of the accounts. The black line is the result of adjusting those figures to see what is the underlying cash flow that can be expected to recur, by removing acquisitions, disposal of assets and divestments of subsidiaries that were one-off events.
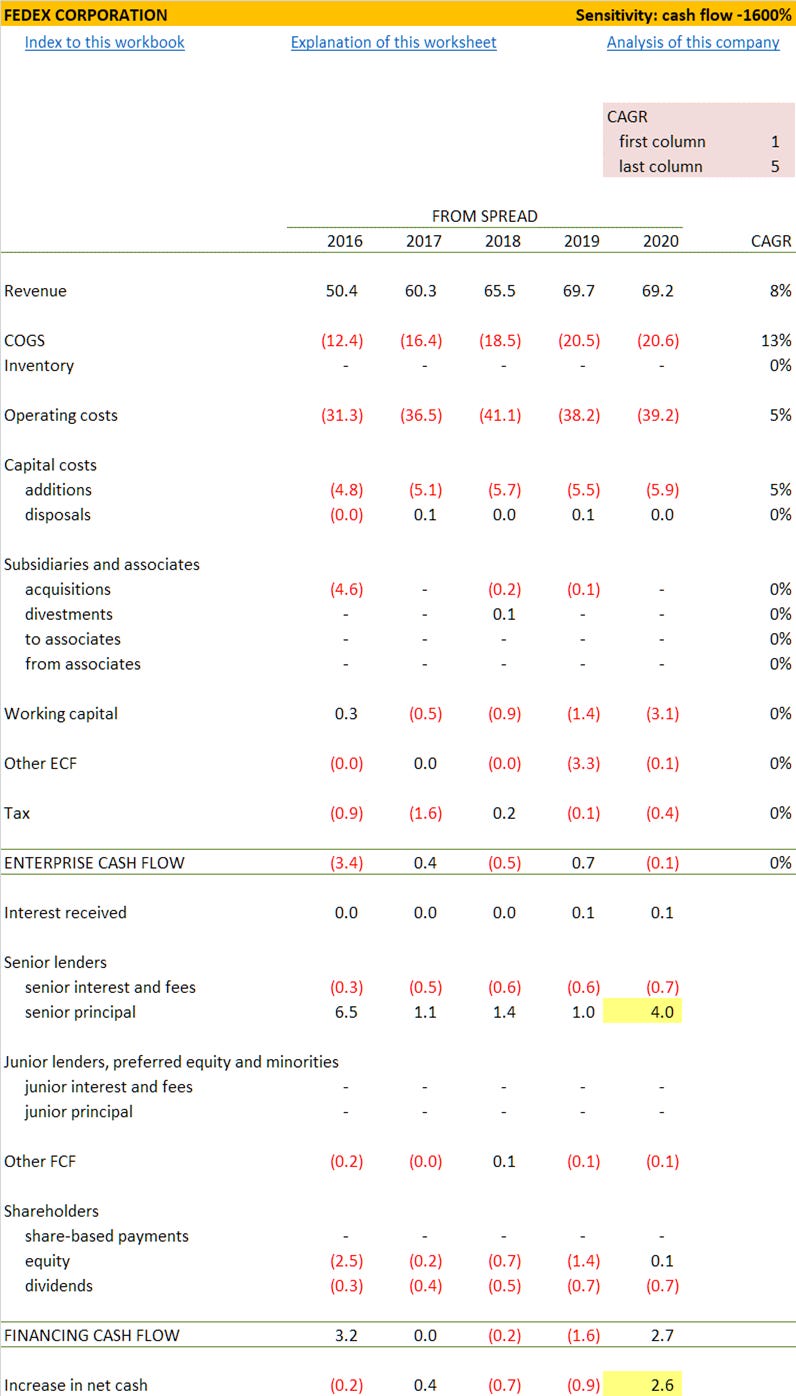
The figures that these graph lines are showing are taken from a direct representation of FedEx's cash flows, highlighted in yellow below. [5]

We can see that far from generating $9b or anything close to it, FedEx's cash flow has not broken past $1b in any of the past four years, and was negative in two of them.
Plausible future?
Our first instinct is that the cash flow FedEx is generating is so far from what it needs to be to make sense of current valuations that current investors must be delusional. However, when a company's revenues and costs are closely matched, with the difference between them as close to zero as FedEx’s are, it only needs moderate shifts in the revenue or cost lines to have a dramatic effect. For this reason it is possible to construct a story in which FedEx increases its cash flows to the point where they justify the current valuation. We do this in the cash flow projection below. [4]
The ingredients are
improving margins [highlighted yellow in the projection]
declining capital costs [highlighted red]
controlled use of working capital outflows [highlighted blue in the projection, without outflows lower than before]
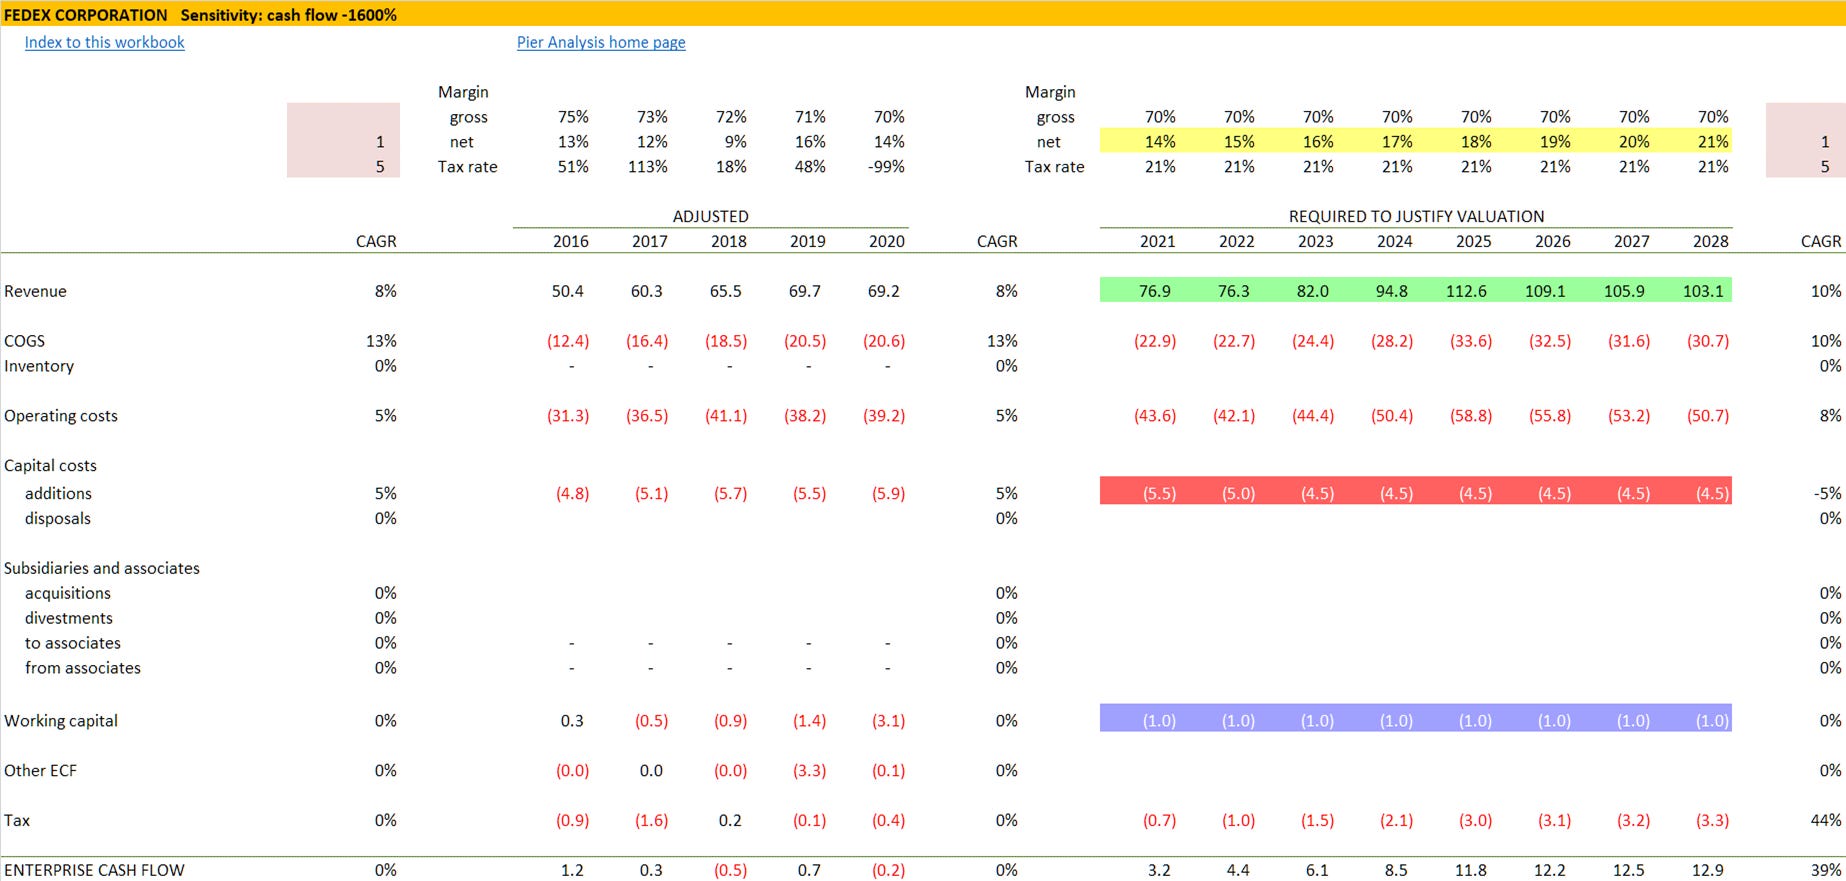
The revenues needed to deliver these margins and consequent cash flows rise just a bit faster than recent years [yellow in the projection], which is the essence of the case currently being made for FedEx as an investment.
Pandemic
Covid might help the revenues of delivery companies by provoking more shopping online, but it might also increase their costs. For its part, Royal Mail reported that it spent £80m on protective measures for its employees. FedEx reports that its equivalent figure is $125m. Although FedEx’s market capitalisation is 20 times Royal Mail’s, its employee count is only two and a bit times larger, at 400,000 versus 162,000.
No doubt there are other areas in which costs will rise; but FedEx is in a position to benefit from the current disruption that few others share. Much freight is carried in the holds of passenger planes. While they are grounded, international businesses are turning to FedEx, whose fleet is still flying.
During 2020, an outbreak of a new strain of coronavirus (“COVID-19”) was declared a pandemic by the World Health Organization. We began to experience business impacts from the COVID-19 pandemic as early as January 2020 when transpacific traffic was affected by the shutdowns in China and curtailment of commercial air flights. While commercial volumes were down due to business closures across the world, FedEx Ground residential delivery volumes increased to seasonal peak levels during the fourth quarter of 2020 due to stay-at-home orders and other pandemic responsive measures. Additionally, we experienced a surge in transpacific and charter flight demand at FedEx Express in the fourth quarter of 2020, as airfreight capacity was limited due to restrictions on commercial activities.
Like Royal Mail, FedEx has a March year end. This means that the accounts reflect the first two or three months of the pandemic in a way that would not be so for a company that reported to calendar year ends. And like Royal Mail, the cash flow shows clearly that FedEx has drawn down its borrowing lines.
On March 18, 2020, we elected to draw $1.5 billion under the 364-Day Credit Agreement to increase our cash position to preserve financial flexibility in light of disrupted access to commercial paper markets and uncertainty in the global financial markets resulting from the COVID-19 pandemic.
As the direct cash flow shows, FedEx has drawn down not only this $1.5b, but another $2.5b from other lines of credit available to it.
As the FT reports (article behind paywall, image from it in front of paywall) ,these firms are far from alone.
Another turnaround
Like Royal Mail and DX, FedEx is a turnaround story. None of the three make respectable money at the moment.
What FedEx needed to do to justify its share price in March was not implausible, though it would have taken courage to act on it then because it was at the peak of virus-induced uncertainty. Now that the share price has doubled, what it needs to accomplish is much more of a stretch. But if investors exist who are willing to believe in FedEx's story, then those same investors may think that Royal Mail and DX Group, whose turnaround stories feel rather closer to being believable, are not overpriced.
What next
A distinctive feature of Pier Review is that it provides the financial model that underpins each analysis. To receive the spreadsheet
if you have not done so already, subscribe to Pier Review by using the box below
click here to pre-populate a message in your usual email program requesting that the spreadsheet be sent to you
switch to your email program and click Send to despatch the request.
If you find this analysis interesting, you can sign up to have others like it delivered to your inbox several times a week.
Share Pier Review with interested friends.
Notes
[1] Source: Wikipedia
[2] The choice of 10% is distinctive to Pier Analysis. Most analysts would use something lower. The intention is to build in a significant margin of safety.
[3] The choice of 15 years is distinctive to Pier Analysis. Most analysts would use a longer period. The intention is to build in a significant margin of safety.
[4] Technically, what we are looking for here are future cash flow profiles that have a present value equal to $75b, FedEx's enterprise value, when discounted at 10% pa over 15 years. Any one of the cash flow profiles discussed would put FedEx in the position to return our investment within 15 years and give us a 10% return while we wait for it.
[5] Companies generally use an indirect format to show their cash flows. Recasting them in a direct representation is a distinctive practice of Pier Analysis. It makes them easier to understand and makes noteworthy patterns easier to spot. It is a routine habit of the infrastructure investors from which Pier Analysis draws its inspiration.