


BT (British Telecom)
Enterprise cash flows are improving. Financing cash flows, not so much.
It’s hard to believe that Apple, Tesla and similar companies will one day become boring has-beens. But that’s what has happened to BT.
Originally known as British Telecom, it was carved out of the UK Post Office and privatised in 1984. The rest of that business eventually became what is now Royal Mail, which we covered in July.
As the potential of the internet became apparent in the late 1990s, telecoms companies were the only credible conduits for the traffic that was sure to grow explosively. Many investors became convinced that these companies would become valuable, and they were among the glamour stocks of the age. Who would invest in Apple, a little company which made toy computers, when you could have the monopoly provider of telephony to an entire western economy? BT’s share price went from £1.30 on flotation to a peak of over £15 in 2000.
Many of Pier Review’s readers are old enough to remember this time. To those who aren’t, we should perhaps offer a spoiler alert: the saga ended badly. The day before writing this, BT’s shares fell below £1, and its credit rating has moved from Aa1 to Bbb. At least it is still here, which is more than can be said for many of the companies that were swept up in the millennial mania. Some were silly, offering services such as just in time deliveries of dog food or razor blades. (Hint: both of these things are freely available in your local supermarket or convenience store.) Others were communications companies just as large as BT.
What is striking about the current surge in technology valuations is what little part the telecoms companies are playing in it this time round. Nobody seriously argues now that BT, Verizon, Vodafone and similar companies share the allure of Apple and Tesla. Yet twenty years ago it was widely argued that the telecoms companies would be among the elites of the future. The contrast between these outlooks should serve as a warning to those who are over confident in the prospects of the FATMAAN stocks we covered in our last articles.
Or might today’s presumptions be the ones that are mistaken? Is the misplaced enthusiasm for telecoms companies of the late 1990s mirrored now by a systematic underestimate of the value of these firms? In this article, we will take a look.
Against the regulations
Before we do, we must remind ourselves of one detail. When privatised, British Telecom had the monopoly already mentioned. A competitor called Mercury was cobbled together out of a consortium led by Cable & Wireless, to make the position less embarrassing, but it did not flourish, and was not enough to obviate the need to do what western governments find necessary when confronted by monopolies, which is to regulate them.
The role of the regulator is to simulate the effect of competition where none exists, by limiting the ability to increase its prices to the level which leads the monopoly to earn a rate of return equal to the one that would result if it was working in an ideally functioning market. The way this is done in the UK, any outperformance that management contrives to wring out of a business is clawed back by the regulator in the next pricing review, which typically come at five or seven year intervals, depending on the industry. As a result, Pier Analysis will not invest in any regulated utility.
This is no longer a concern about BT for it has, for the most part, ceased to be a regulated business. When it was formed, most houses had one telephone, or none at all. Anyone who asked for an extension to allow a second handset to be installed in the bedroom was given an appointment for an engineer to call in six months' time. Now, anyone who wants a phone can get a mobile one in any high street in a matter of minutes. So numerous are the companies would be delighted to win your business for a fixed phone line that comparing them has become a business in itself, with half a dozen websites devoted to the task. The regulator decided in 2009 that real competition in the industry had grown to the point where it could abdicate from the role of simulating it.
This is not to say that BT has escaped regulation entirely. Though it has long shed its monopoly in fixed line telecoms to homes and business premises, it remains dominant in wholesale markets. Those companies that are clamouring to offer broadband and phone services to UK customers are largely reselling capacity that they buy from Openreach, a BT subsidiary that operates the main telephone cables and switching systems in the UK. If something goes wrong, these suppliers will call out from Openreach the same engineer that BT would have despatched to you if BT had remained your supplier. Openreach’s activities remain the subject of regulation, and there is political pressure on BT to divest itself of the business, both so that BT can’t access Openreach's services on any preferential basis, to the disadvantage of its smaller competitors, and because BT is not perceived to run Openreach very well.
BT’s 2020 accounts report Openreach as accounting for 10% of the company’s revenue. That’s small enough to consider regulation as insignificant to consideration of BT as a whole. Openreach is, however, the only part of BT's operations with sales that are growing.
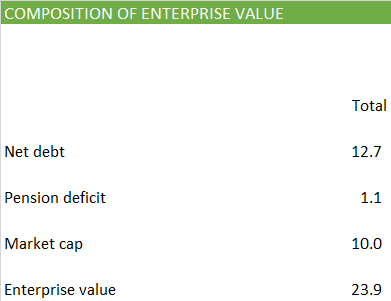
Enterprise value
The first step in our analysis is a calculation of BT's enterprise value. To do this we look at the balance sheet to see how much debt it has. We find that the answer is £19.3b. Offsetting that is £1.5b of cash and £5.1b of investments. The investments are a curiosity which we will be talking about more later. Net, the debt amounts to £12.7b.
We also extract the liabilities that BT has to provide pensions. Conservatively compared with many other analysts, Pier Analysis chooses to treat such liabilities as another form of debt.
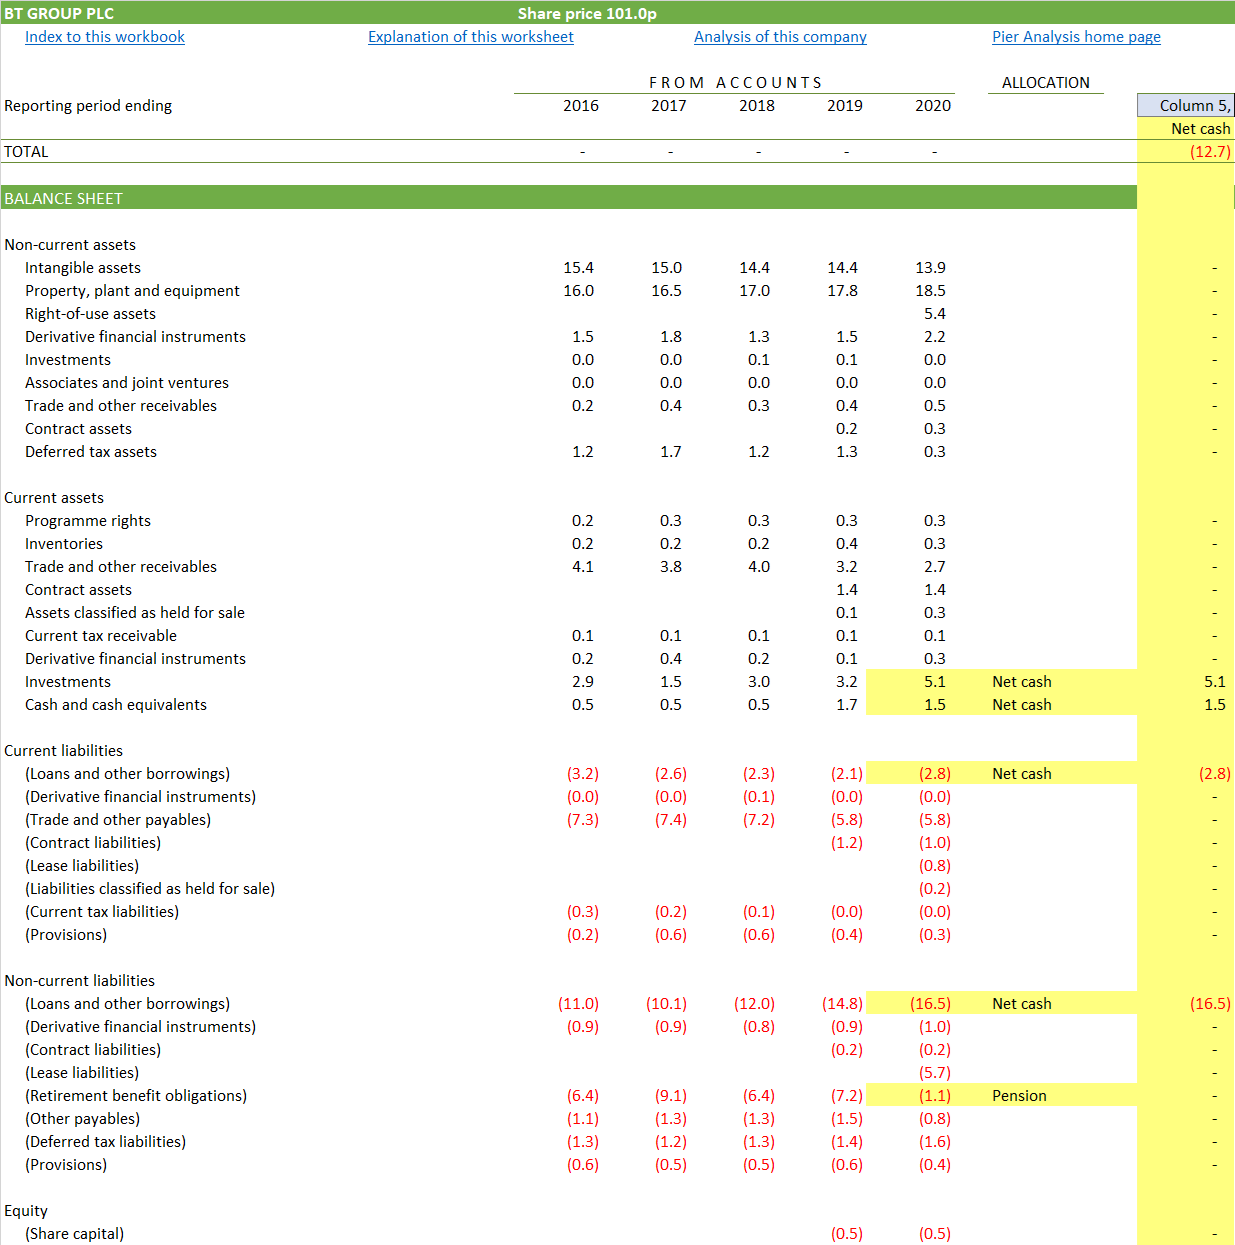
We combine these figures with the current market capitalisation of BT’s shares, which serves as the value of its equity. Together, we find an enterprise value of £23.9b.
Cash flow required
Our first instinct on seeing this figure is to hope that BT generates cash flows of around £2-3b. That is because Pier Analysis believes that investors ought to want a return of around 10% pa to compensate them for exposing themselves to the uncertainties of investing in any business, not least because returns not far short of that figure are available from funds that invest in the kind of infrastructure on which we all rely, such as transportation and power generation.
More exactly, we need to believe that BT has a reasonable prospect of generating cash flows that are large enough to pay back this £23.9b of enterprise value, and to give us our 10% pa return while we wait for it to do so. Pier Analysis chooses to allow fifteen years for this to happen, since that is comparable with the time horizon of one of the funds just mentioned, which would hold assets that were on average half way through a typically thirty year life time.
There are countless profiles of cash flow that would have these properties. Some are drawn in the graph below.

Among the range of trajectories that would do the job is one in which cash flow starts around £3.0b and rises gently to £3.4b: this is the violet line.
Another way is to deliver a cash flow that is lower than this range in the early years, say £1.3b, but makes up for that by growing rapidly so that it is significantly higher in the later years, reaching £4.2b. This is the red line.
Any one of the cash flow profiles shown would put BT in a position to return our investment within 15 years and give us a 10% return while we wait for it.
Cash flow achieved
Now that we have some sense of the cash flow that BT needs to generate in order to justify an investment in it, given our chosen time horizon and rate of return, we can look to see whether that is at all plausible, by comparing it with the cash flow that BT has delivered in the recent past.
The black line at the left of the chart shows that BT has delivered a cash flow in the last five years that averaged £2b. More some years, less in others. The accounts show a different pattern, shown in grey, but Pier Analysis has adjusted the figures to remove acquisitions, divestments and disposals that will not recur, in pursuit of a measure of BT’s underlying ability to generate cash.
The top part of the cash flow shows how this enterprise cash flow is derived.
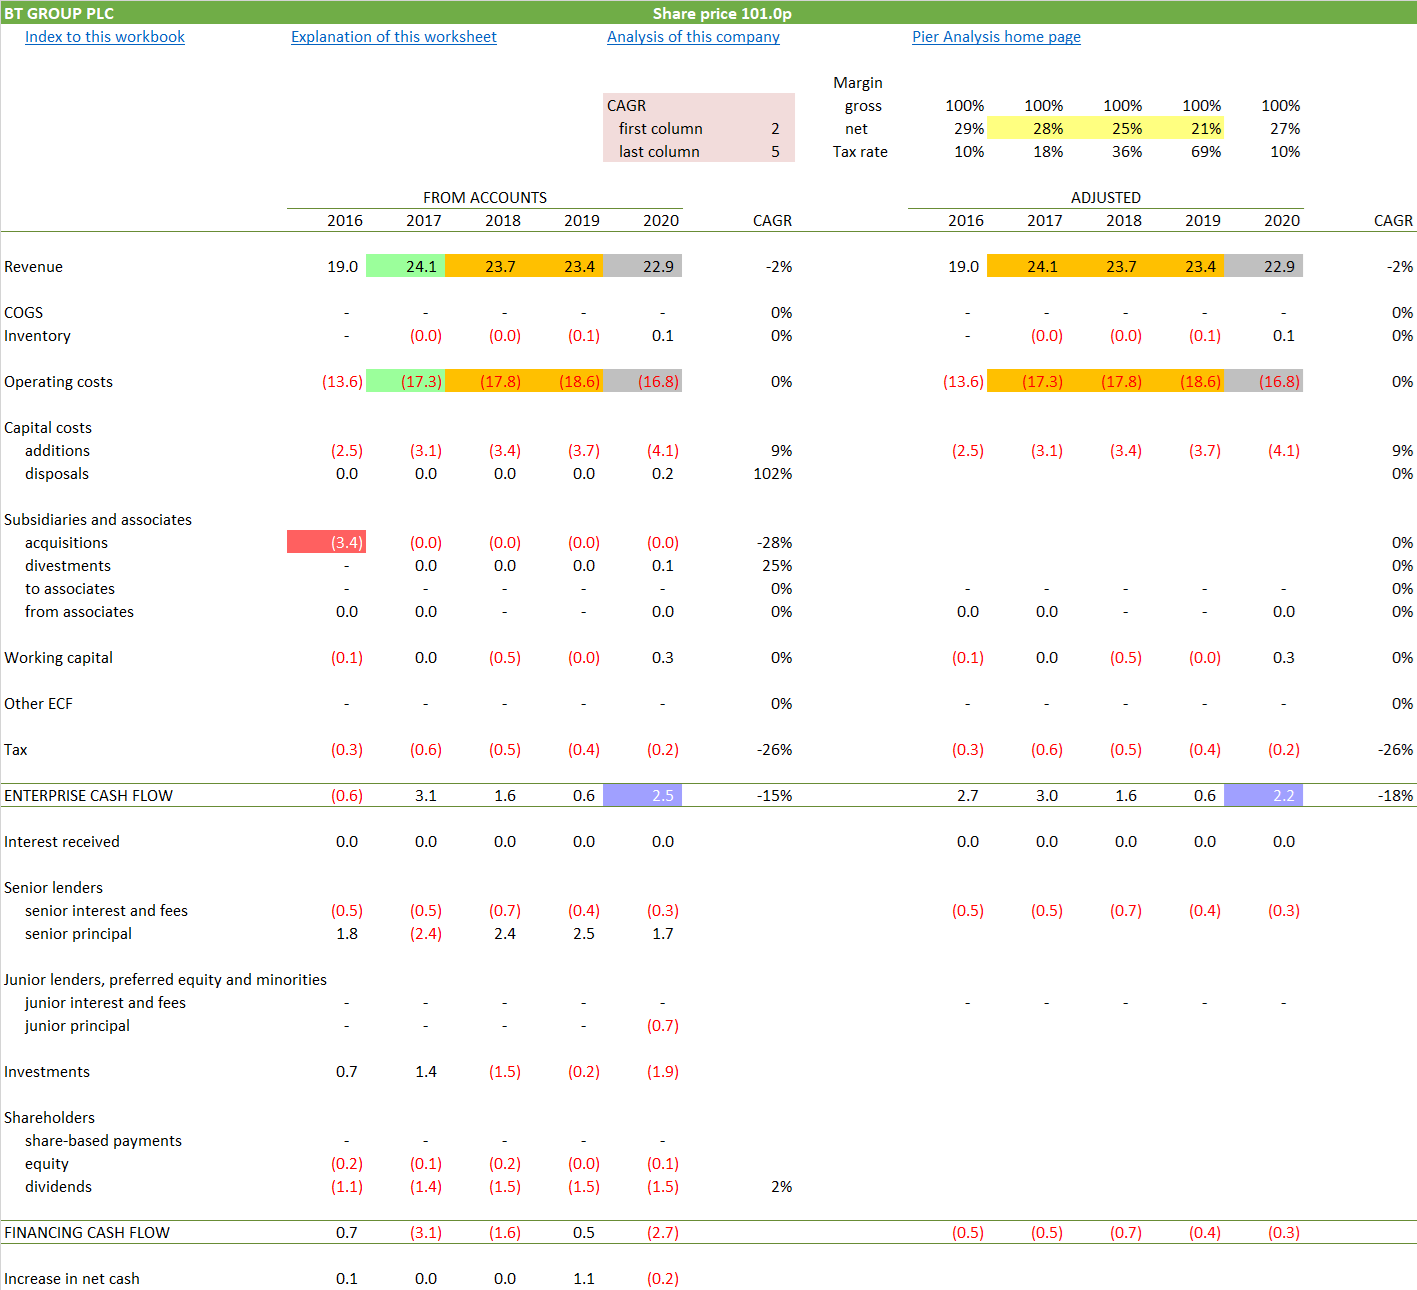
Here we can see:
Highlighted in red: The acquisition in 2016 of EE, one of the UK’s mobile phone operators, from Deutsche Telekom and France Telecom. The consideration was £11b, but only £3b was in cash. The rest took the form of shares, leaving the interest in the business of existing shareholders appreciably diluted.
Highlighted in green: The effect in 2017 of EE’s activities combining for the first time with BT’s, and lifting revenues and costs by 26-28%.
Highlighted in orange: Between 2017 and 2019, a gradual erosion of revenue at around 1% pa, while costs rose by about 4% pa in the period.
Highlighted in yellow: As a result, cash operating margins shrank by a third, from 28% to 21%.
Highlighted in grey: Revenues continued to fall in 2019/20, but costs were cut by almost 10%.
Highlighted in blue: As a result, a steady decline in cash flow has been reversed.
Here’s what the annual report had to say about this change.
Revenue
Reported revenue fell by 2% …This was primarily due to the impact of regulation, declines in legacy products, strategic reductions of low margin business and divestments. This was partially offset by growth in new products and services and higher rental bases of fibre-enabled products and Ethernet.
Operating costs
… operating costs were down 2%. This was mainly driven by savings from our ongoing transformation programmes, partially offset by increased business rates, investment in customer experience and increased salary costs in Openreach to support FTTP rollout and better service.
Our cost transformation programme announced in May 2018 is complete with an annual benefit of over £1,550m and an associated implementation cost of £670m. During the year there was a reduction of 5,000 roles, taking the total to 9,000 over the past 2 years.
The next phase of our transformation will focus on simplifying our product portfolio, simplifying and automating our customer journeys, moving to a modern, modular IT architecture, and migrating customers from our legacy networks to our modern FTTP and 5G networks. This will deliver annualised gross cost savings of £1bn per annum by the end of March 2023, realised in broadly equal annual increments, increasing to £2bn per annum by the end of March 2025. The savings will comprise reductions in both our total labour costs and spend with external suppliers.
… We anticipate that the one-off cost to achieve these savings will be £1.3bn in total across the five years of the programme, of which £900m will be invested in the first three years, including around £400m this fiscal year.
Any future savings in operating costs may be offset by increases in capital expenditure.
BT also stands ready to make the biggest communications infrastructure investment in the UK in a generation – that includes building our full fibre network to 20m premises by the mid- to late-2020s.
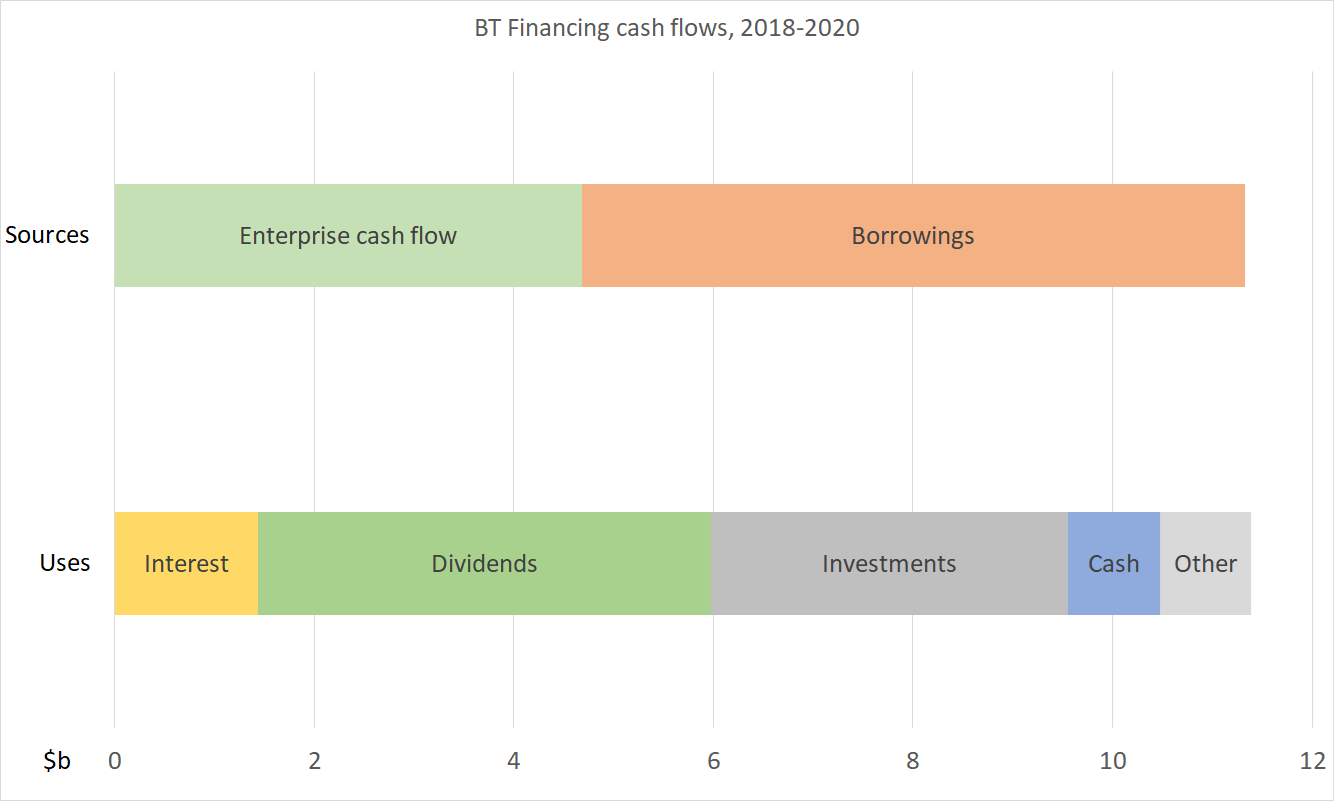
Financing
When we compare the £2.2b of adjusted cash flow with the £23.9b we derived for the enterprise value, we see that BT is offering a cash flow yield of 9%. Combine this with the promise of further cost cuts, and it looks tempting. It’s not until one looks at BT’s financing cash flow that things head south.
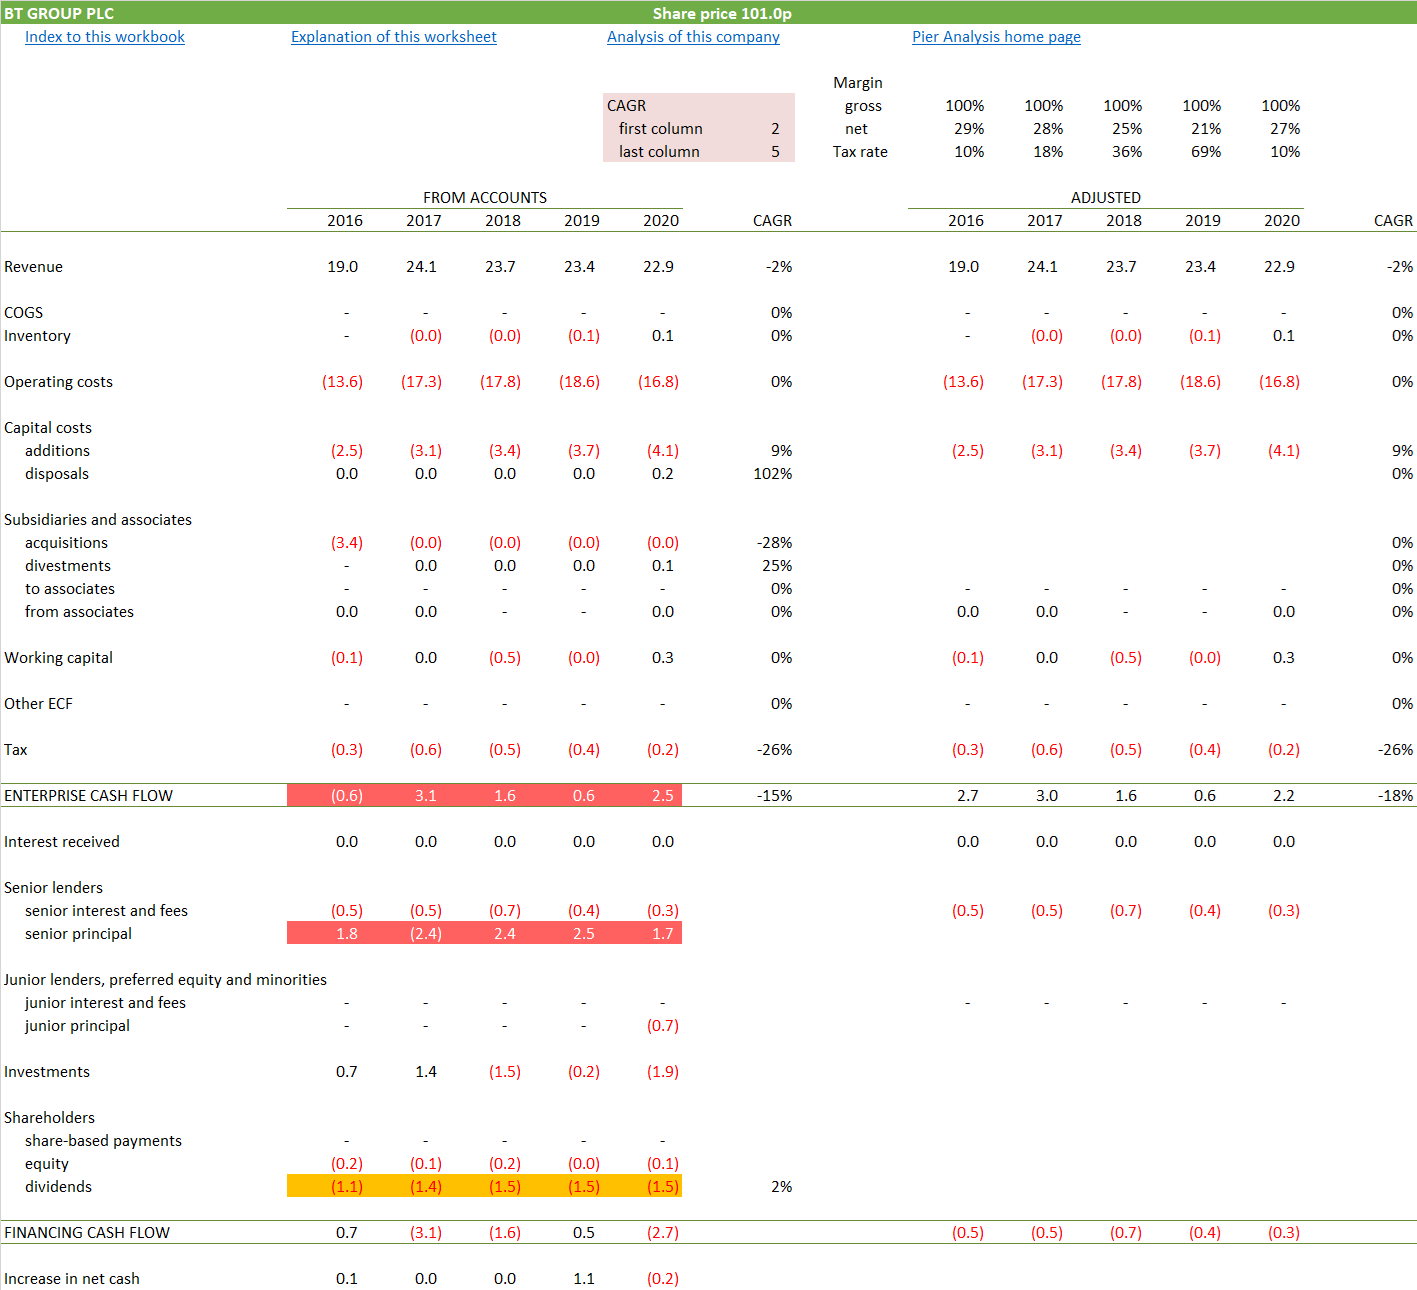
Highlighted in red: For every £100 that BT has generated in cash flow since 2016, it has borrowed an additional £84.
Highlighted in orange: This borrowing is a sign that the dividends that BT has been paying out are larger than it can afford.
Indeed, BT has recently announced a suspension of dividend payments, and an intention to rebase them to a lower figure when they resume. The annual report attributes this cut to the needs
to sustain critical national infrastructure – as magnified by the Covid crisis
for stakeholders [to be in a position] to trust and rely on the connectivity we provide
to make the biggest communications infrastructure investment in the UK in a generation – that includes building our full fibre network to 20m premises by the mid- to late-2020s.
It goes on
To maintain such trust, whilst creating capacity for value-enhancing investment and navigating the unprecedented uncertainties caused by Covid-19 without compromising our credit rating, the Board concluded that the prudent and proper decision was to suspend the 2019/20 final dividend and all dividends for 2020/21, and re-base future dividends to a more sustainable level. The Board believes that this decision is in the best long-term interests of shareholders.
A 30 June 2020 report by Fitch gives the impression that safeguarding the credit rating may have played a larger role in the dividend decision than the above admits. Borrowing to pay dividends has lifted the company’s net debt to the point where, when combined with the pension liability, it is twice as large as the market value of the equity. As a result, the debt cover ratios make for uneasy reading. They are not reproduced here but are to be found in the financial model, which is available to subscribers to Pier Review.
The financing cash flow also shows something strange. The amounts borrowed have not been used solely to pay dividends. In the past three years, £4.5b has been stored as “investments” and cash.
It seems most odd to lift one’s debt to the point where the credit rating, already not stellar, is in question, only to squirrel the proceeds away on the balance sheet.
Drawing down credit facilities and holding the resulting cash in a separate account is something firms do when they don’t think the credit facilities can be relied upon to remain accessible, for example when they foresee a looming crisis of liquidity or confidence. That does not seem to be the case here. A good many firms have made similar drawdowns to provide liquidity to weather the pandemic, but at BT this pattern has been going on since 2018, long before Covid was known.
From the annual report:
How do we manage liquidity risk?
Management policy
We maintain liquidity by entering into short and long-term financial instruments to support operational and other funding requirements, determined using short and long-term cash forecasts. These forecasts are supplemented by a financial headroom analysis which is used to assess funding adequacy for at least a 12-month period. Our treasury operation reviews and manages our short-term requirements within the parameters of the policies set by the Board. We hold cash, cash equivalents and current investments in order to manage short-term liquidity requirements.
Which is all as it should be. Even so, we are bemused by borrowing to hold liquid assets that could keep the company operating for over 17 weeks, even if all revenues stopped overnight.

Verdict
BT’s cash flow has been improved by an impressive cost reduction. The cash flow would not need to improve much more to be large enough to justify the undemanding level to which the long-declining valuation has fallen.
Against that, BT’s debt is large enough to provoke an unflattering credit rating, and it took the elimination of the dividend to head off a downgrade. The treasury policies are a mystery, one that might have an entirely rational explanation, but which acts as a deterrent until they are understood.
Above all, the company seems unable to find any way to stop its revenues from shrinking, as its share of the market recedes faster than the market for bandwidth is growing, and prices fall. It advances its strategy of "having the largest and best converged network", ie of providing seamless switching between domestic and workplace broadband delivered over fibre, and public wifi and 5G networks while on the move, without offering any strong reason to believe that the revenue trend will reverse as a consequence of the billions of pounds of investment that it will cost.
Recent rumour has suggested that plans are being assembled to bid for BT. Reports identifying Macquarie as a potential buyer were quickly denied. Buyers of that kind may do what current management may shrink from: unbundling Openreach, and executing elements of the 5G roll-out in separately financed project vehicles rather than insisting on doing it all within BT. There must be some price at which these ideas make sense, but betting that someone will step forward to move ahead with them is a speculation rather than any form of investment.
What next?
A distinctive feature of Pier Review is that it provides the financial model that underpins each analysis.
Many current valuations only make sense to those who are content with a return of less than 10%, and willing to wait more than 15 years for the return of their investment. If you are one of those, you can use the model to examine the effects of these less demanding requirements. You will see the coloured lines on the graph, which show the projection of cash flow required to justify the valuation, will shift downwards. (The black lines on the chart will not move, since they are the result of BT’s reported historic performance.)
To receive the spreadsheet
if you have not done so already, subscribe to Pier Review by using the box below
click here to pre-populate a message in your usual email program requesting that the spreadsheet be sent to you
switch to your email program and click Send to despatch the request.
If you find this analysis interesting, you can sign up to have others like it delivered to your inbox several times a month.
Share Pier Review with interested friends.