


Seeing Klingons
It would be hard to find greater fans of Zoom’s video conferencing service than the team behind Pier Review. When we first saw it three years ago, we loved it at once, because it was the first such thing that actually worked. Even now, we simply decline to attend events hosted over Webex, which was once the market leader in the field, as the difference in sound quality is the difference between good FM and poor AM radio, and Webex neither makes nor holds connections reliably.
For the generation brought up on Star Trek, at last, we could have in our own laptops the technology that Captain Kirk used to forge his alliances and, rather more often, confront threats to the Federation. The reaction was emotional, visceral, with the strongest word of mouth since the emergence of Google into the field of search engines. Employees in many companies dragged their IT managers to Zoom emphatically and away from more obviously corporate offerings from Microsoft and others.
This was a happy platform on which to enter a pandemic that forced the professional classes to working from home. Investors have reacted with an enthusiasm similar to Zoom’s customers. Launched at IPO at a valuation of $9b, Zoom’s shares doubled over night, and have trebled again since the start of the confinement in March. The capitalisation now stands at $68b.
Is this valuation supported by Zoom’s underlying economics, or is it driven by the same passions as motivate Zoom’s users? Let’s have a look.
Billionaires
Most of the $13b proceeds of the 2019 IPO fell into the pockets of the private equity businesses fortunate enough to back the business at an early stage. Zoom’s balance sheet shows that it has just retained just under $1b.
$1b of cash is minus $1b of debt; and this minus $1b of debt needs to be combined with the $68b that, we have learned already, is the current capitalisation of the equity, to give an enterprise value of $69b.
Showing the characteristics of a company in nice round billions is an entirely reasonable thing to do if it has a $69b valuation. Let us take a look at Zoom’s balance sheet on this basis.
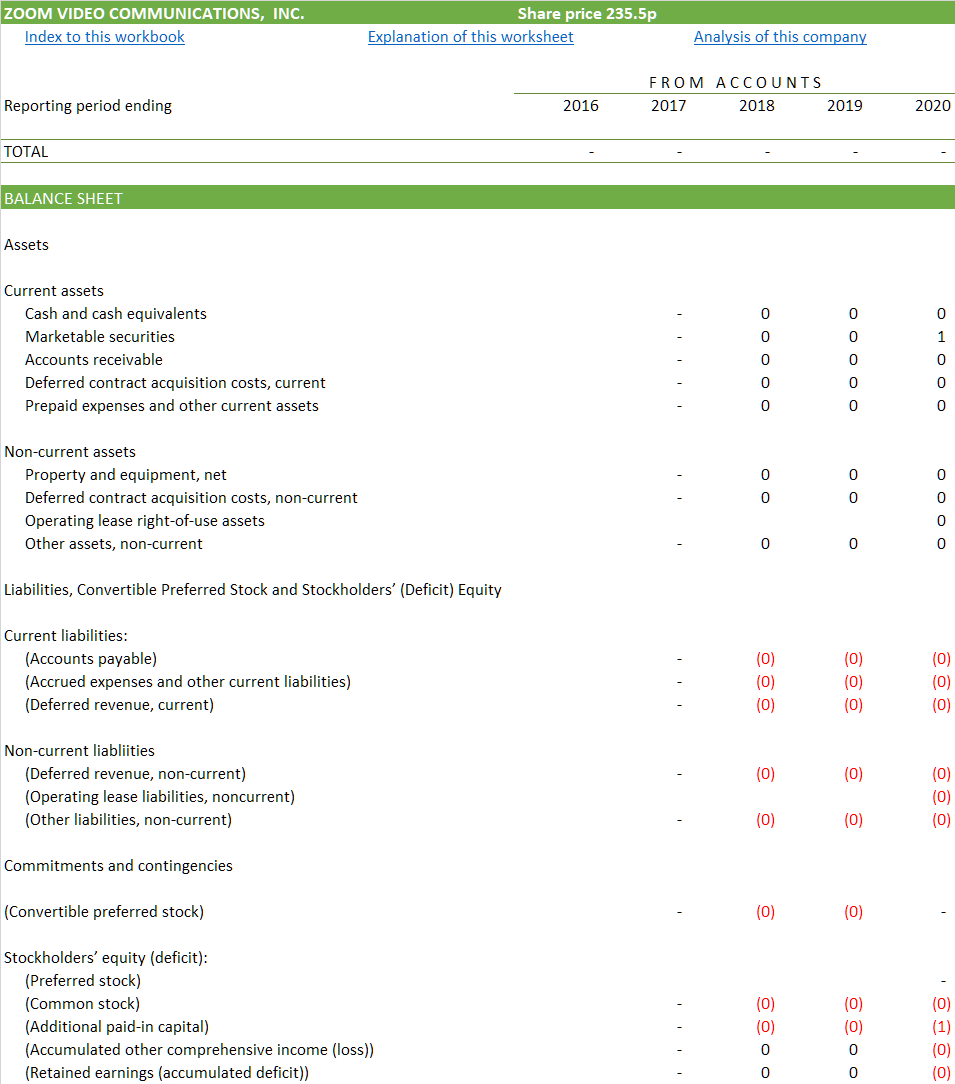
What we see is close to empty space. Some of that is excusable: Zoom is so new that it had nothing to report in 2016 or 2017. But even in 2020, the numbers are so much smaller than the valuation that they round down to zero.
The same is true for the cash flow. Only two numbers are visible in it: the revenue, and the cash retained by the company in the IPO, which is what gave rise to the negative net debt just mentioned. Otherwise, we find an empty galaxy.
In more detail
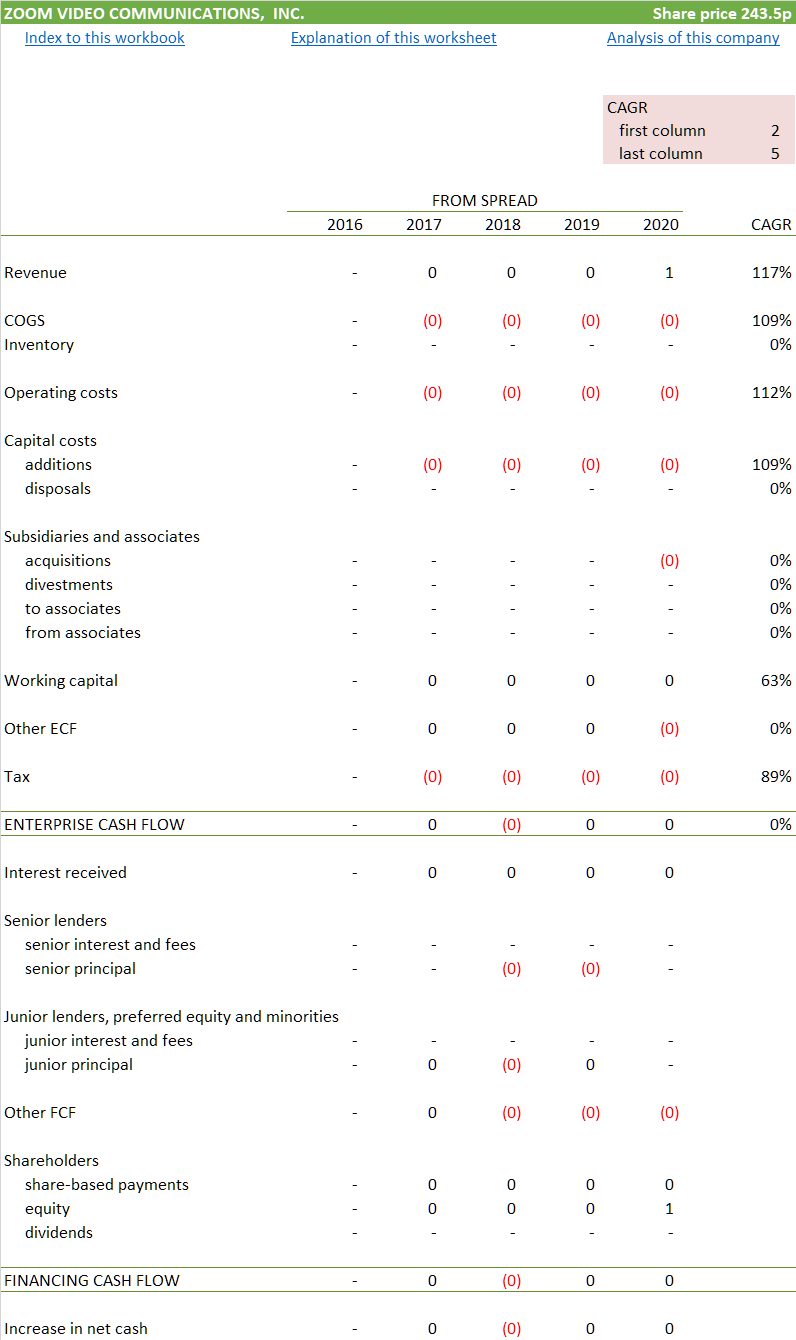
Let’s zoom in (yes) and take another look at a range more sensible for this business, millions rather than billions. We can see that Zoom has more than doubled its revenue in every year that it has reported figures.

Zoom’s enterprise cash flow became positive two years ago, and that too doubled between 2019 and 2020. (Zoom’s financial year ends at the end of January, so these results largely derive from from 2018 and 2019.) Most growing businesses consume cash in the form of working capital. In Zoom’s case, working capital movements benefitted cash flow, which is not unusual with software businesses. If Zoom didn’t have these positive working capital characteristics, it wouldn’t yet be cash generative.
The working capital point leads to one source of anxiety: the inducements offered by Zoom’s salesman to the Pier Analysis team in the final days of Zoom’s financial year to switch to Zoom as its phone supplier make sense only if one took on some concerns about the firm’s policies on revenue recognition.
The financing cash flow is dominated by the effects of the IPO. Of $616m retained from the transaction, $457m has been tucked away in the form of marketable securities; and $268m is held as cash. Compared with these figures, the cash generated at the enterprise level has is close to inconsequential.
Testing for reasonableness
Your first thought on hearing that Zoom’s enterprise value is $69b should be to understand that that would make sense if the firm can be relied upon to deliver something in the region of $6.9b of enterprise cash flow. Here, we are holding out for a return on our investment of 10% pa. If you prefer to use a different rate, you can easily scale the required cash flow proportionately.
As we have seen, Zoom is nowhere close to delivering half of one percent of that figure. But that’s all right; it can deliver less in the short run, as long as it eventually compensates by delivering more. We’d like Zoom to get a move on in accomplishing this feat; we don’t think it’s wise to be dependent on a firm still to be in business in fifteen years’ time, least of all in a line of business that Zoom has managed to disrupt as quickly as it has. How long before someone brings in something newer and shinier?
This leads us to a path similar to the red line in the graph below. The black line, flat along the axis, shows what Zoom has accomplished so far.
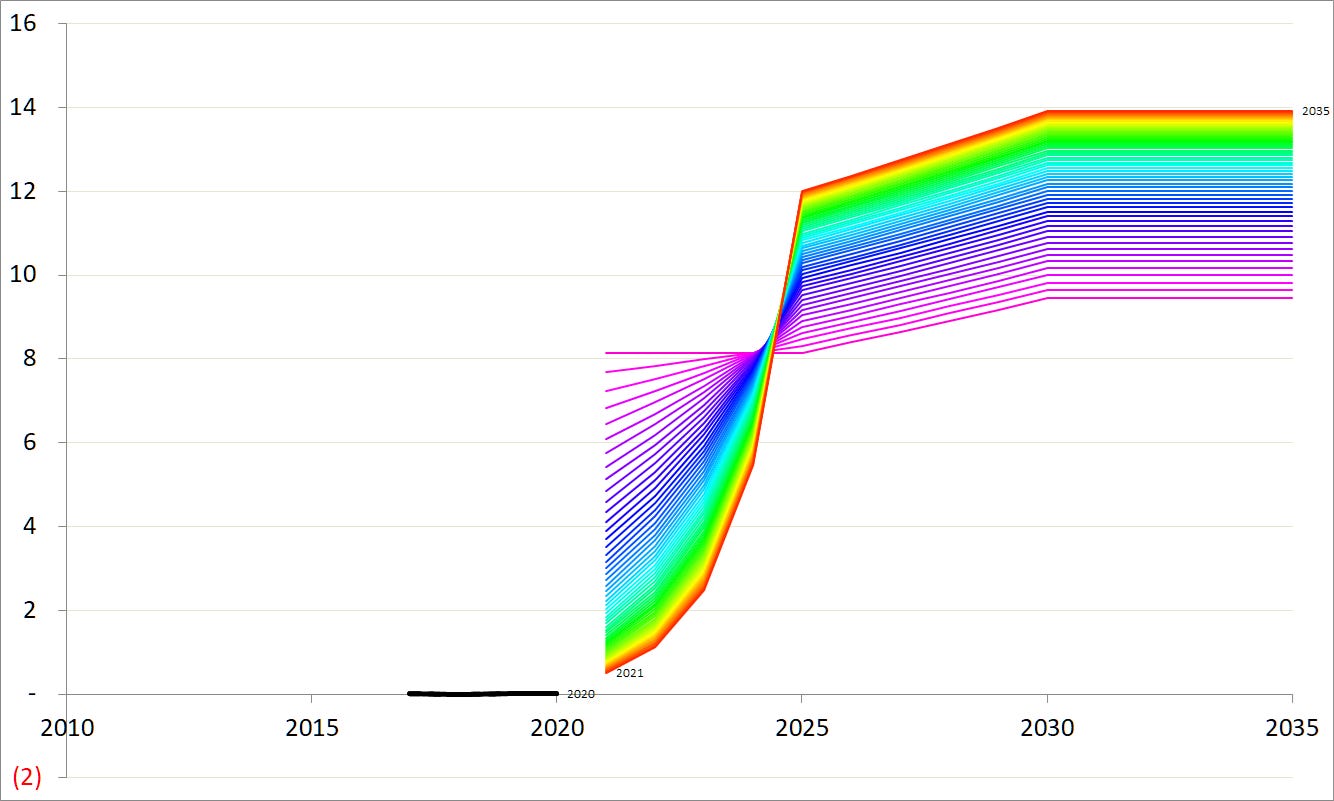
The red line shows that for an investment in Zoom to be rational, we need to believe that it can deliver cash flows north of $12b before the decade is out. Might Zoom do that? Of course it might. Anything is possible. For those who are spending many hours a day in the product, Zoom has the opportunity to offer the basis for a platform to rival portions of the offerings of Google and Microsoft. It’s already offering telephony elegantly integrated into the video app, and its chat function is enough for firms with simple requirements to use instead of Slack or Microsoft Teams. It recently announced its intention to serve as a platform on which other businesses can build their offerings.
But that’s a long way from saying that the $12b outcome is certain. A stake in Zoom is not an investment, but a speculation that it can not only displace large parts of the market for business travel, which is highly possible, but also capture some of that value for itself. Of that there is so far no evidence. Or the investment is a bet on the behaviour of the rest of the crowd, unsupported by any fundamentals.
Recent jump
But, say some, Zoom has indicated that it the number of participants in meetings on its services has surpassed 300 million per day, being just 10 million earlier in the year. Can’t we just multiply last year’s revenue by 30, and won’t that justify the valuation? A quick calculation, not reproduced here, suggests that a thirty fold increase in revenues would get cash flow to increase several hundred fold, since costs won’t rise anything like thirty fold. That would get Zoom unambiguously into the range of cash flow that it has eventually to deliver to justify today’s valuation. But we have two reasons for thinking that a revenue increase on that scale isn’t happening.
Many of the new users are attending church services, or attending lesson courtesy of free licenses given by Zoom to schools in the US and other countries. Few of these are paying for the service. It will, though, be costing Zoom something to provide the extra capacity to carry the additional calls.
Zoom’s first quarter covers February, March and April, late enough to capture at least some of the confinement and the switch to working from home. They show a rise in revenue of 169%, which is a near trebling. Spectacular, but not growth thirty times over.
Odious behaviour
By relative valuation, financiers mean that they look at whether the valuation of a business is low or high by comparison with its competitors. It’s not an approach practised by Pier Analysis. That a business is cheap, or expensive, compared with similar ones doesn’t mean that they are not all expensive, or all cheap. Pier Analysis prefers fundamental analysis of a company’s own numbers. Here we will make an exception.
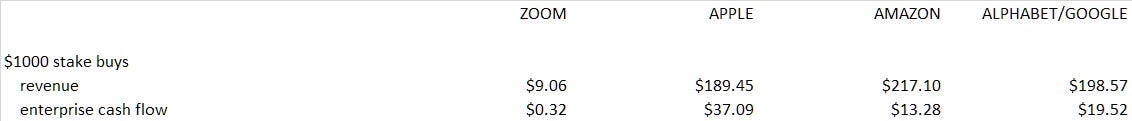
The following table shows the sizes of the balance sheets of three well known tech companies, as well as Zoom. It also shows these firms’ revenue, their enterprise cash flow and their market capitalisation.
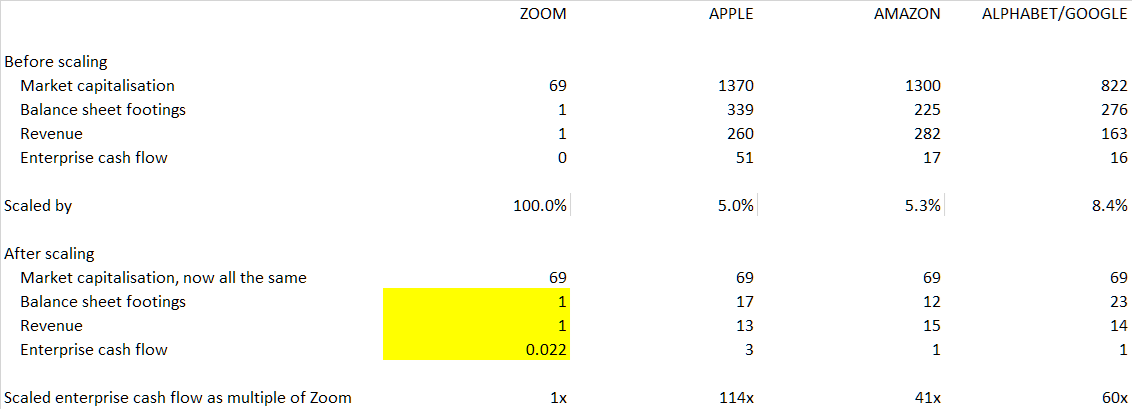
All these other companies have numbers larger than Zoom’s, which is no surprise because they are simply bigger, having been in business for three decades longer. But if we scale the figures, so that the market capitalisations are all, at $69b, the same as Zoom’s, we get some idea of what things would look like if the firms were the same size.
The analysis shows that, in terms of the amount of enterprise cash flow a stake in the business buys, Zoom is 110 times as expensive as Apple. A $1000 in stake buys the holder $37.09 of enterprise cash flow; in Zoom the figure is just $0.32.
True, Zoom is growing steeply, and as our article on Apple shows, Apple is no longer growing at all. Even so, paying 110 times as much as for Apple, a business that’s much more diversified in products and services, and with much more of an ecosystem around it, is best described as stretch.
Conclusion
Zoom is a quite wonderful service, but using the criteria that appeal to Pier Analysis, it is overvalued by a factor of something approaching 15 times. Buying a stake in it is not an investment, but a speculation that other investors will continue to display this hard to rationalise behaviour.
What next?
In this examination, Pier Analysis has required a rate of return of 10% pa and wants to earn it within 15 years. High in the list of distinctive features of Pier Analysis is its willingness to provide its models to subscribers, so that they can use it to explore different assumptions.
If you would like a copy of the model
if you have not done so already, subscribe to Pier Review by using the box below
click here to pre-populate a message in your usual email program requesting that the spreadsheet be sent to you
switch to your email program and click Send to despatch the request.
If you find this analysis interesting, you can sign up to have others like it delivered to your inbox several times a week.
Share Pier Review with interested friends.