This note is part of the Pier Review reference material.
Previous worksheet: Dividends vs debt service. Next sheet: Audit
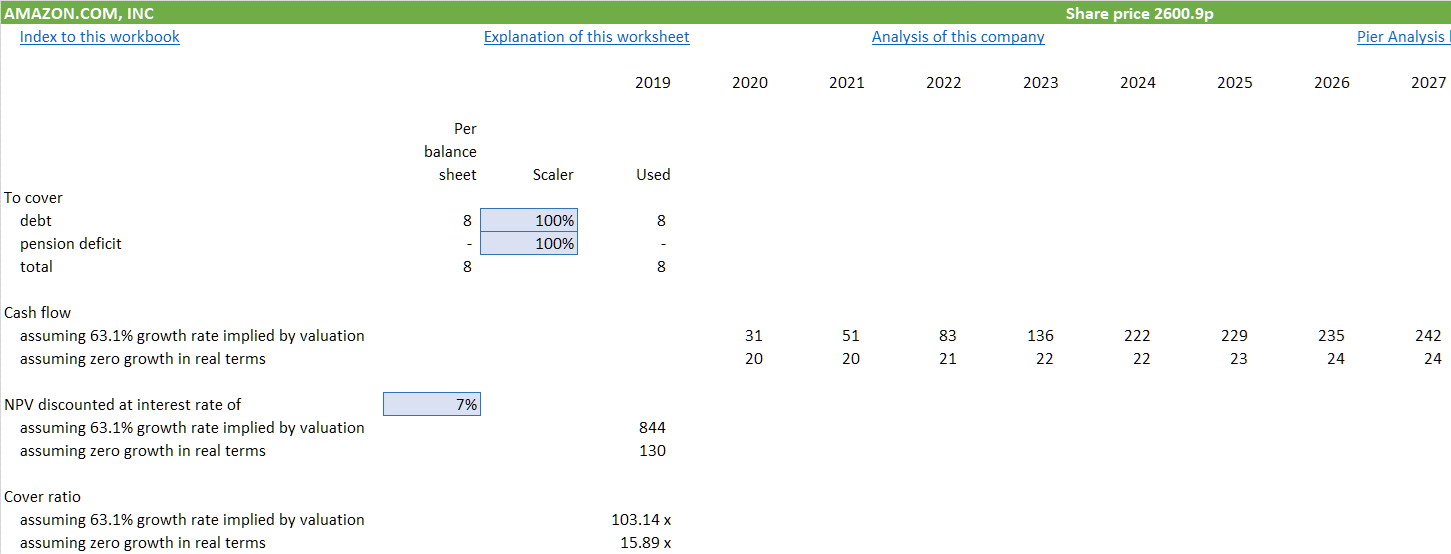
The Debt cover worksheet in the model works out how much of its capacity to borrow a company has already consumed. It does this by calculating a basic figure much relied on in project finance, a business's debt cover ratio.

A debt cover ratio for a business compares
the cash available to service its debt
the cash needed to service the debt.
By servicing the debt, we mean paying the interest; repaying the loan principal, and meeting any fees that the bank may charge. The cash available to do this is what we show on our direct cash flows as the business's enterprise cash flow. Other names for the same quantity are pre-financing cash flow and free cash flow.
The cash available and the cash needed are compared by dividing one into the other. A ratio above 1 means that a company is generating enough cash to make its payments to its lenders. A ratio below 1 means that there isn't enough money to make these payments, for which reason the company is in trouble. So is the bank.
The analysis on this worksheet is intentionally simple. It assumes that banks will lend at 7% pa over seven years. The true figure will vary from business to business and may be higher or lower; but our assumptions are representative enough for the rough and ready analysis we are attempting here. Remember, the idea is not to be exactly right; we are guessing what will happen some years into the future. The idea is to find opportunities that have a noticeable margin of safety, and we certainly shouldn’t be considering opportunities where a small shift in the interest rate or loan maturity assumptions is enough to move you from one side to another of a yes/no decision. If you feel fussy about the 7 year and 7% pa assumptions, you can replace them with ones you consider more realistic, because, uniquely, Pier Analysis gives you the model.
Companies with cover ratios over 2.0 will find banks willing to lend to them. Ones with cover ratios below 1.8 will find it tougher, and ones with ratios below 1.5 or 1.3 will find it very difficult.
One of the distinctive features of Pier Analysis is that it makes no effort to estimate a company's future performance. Instead, it infers what the cash flows need to be to justify the current valuation. It is those cash flows implied by the valuation that are used to perform the debt cover test. Quite often current valuations are bonkers, with the result that the cash flows that Pier Analysis calculates as needed to justify them are implausible. The model therefore provides a second test, in which the assumed future cash flows are based on recent results, and grow very gently from current levels at no more than the general rate of inflation. This second ratio is more plausible, but will likely be noticeably lower than the other one.
The debt cover test is relevant when a cash flow has significant existing debt and cash flow to service it. Where a company has no debt, or cash flow that is negative, the page is not meaningful and may be omitted from the analysis.
What next?
If you find this information interesting, you can sign up to have analysis based it delivered to your inbox several times a week.
Share Pier Review with interested friends.
Previous worksheet: Dividends vs debt service. Next sheet: Audit


