This note is part of the Pier Review reference material.
Previous worksheet: Debt cover.
Double check your work
One of the distinctive features of Pier Analysis is that it shares its reasoning by providing its models to subscribers. That's great, but it comes with some risk: it's all too easy to make a mistake with a spreadsheet.
So large can be the consequences of spreadsheet mistakes that there's a group devoted to studying them: www.eusprig.org.
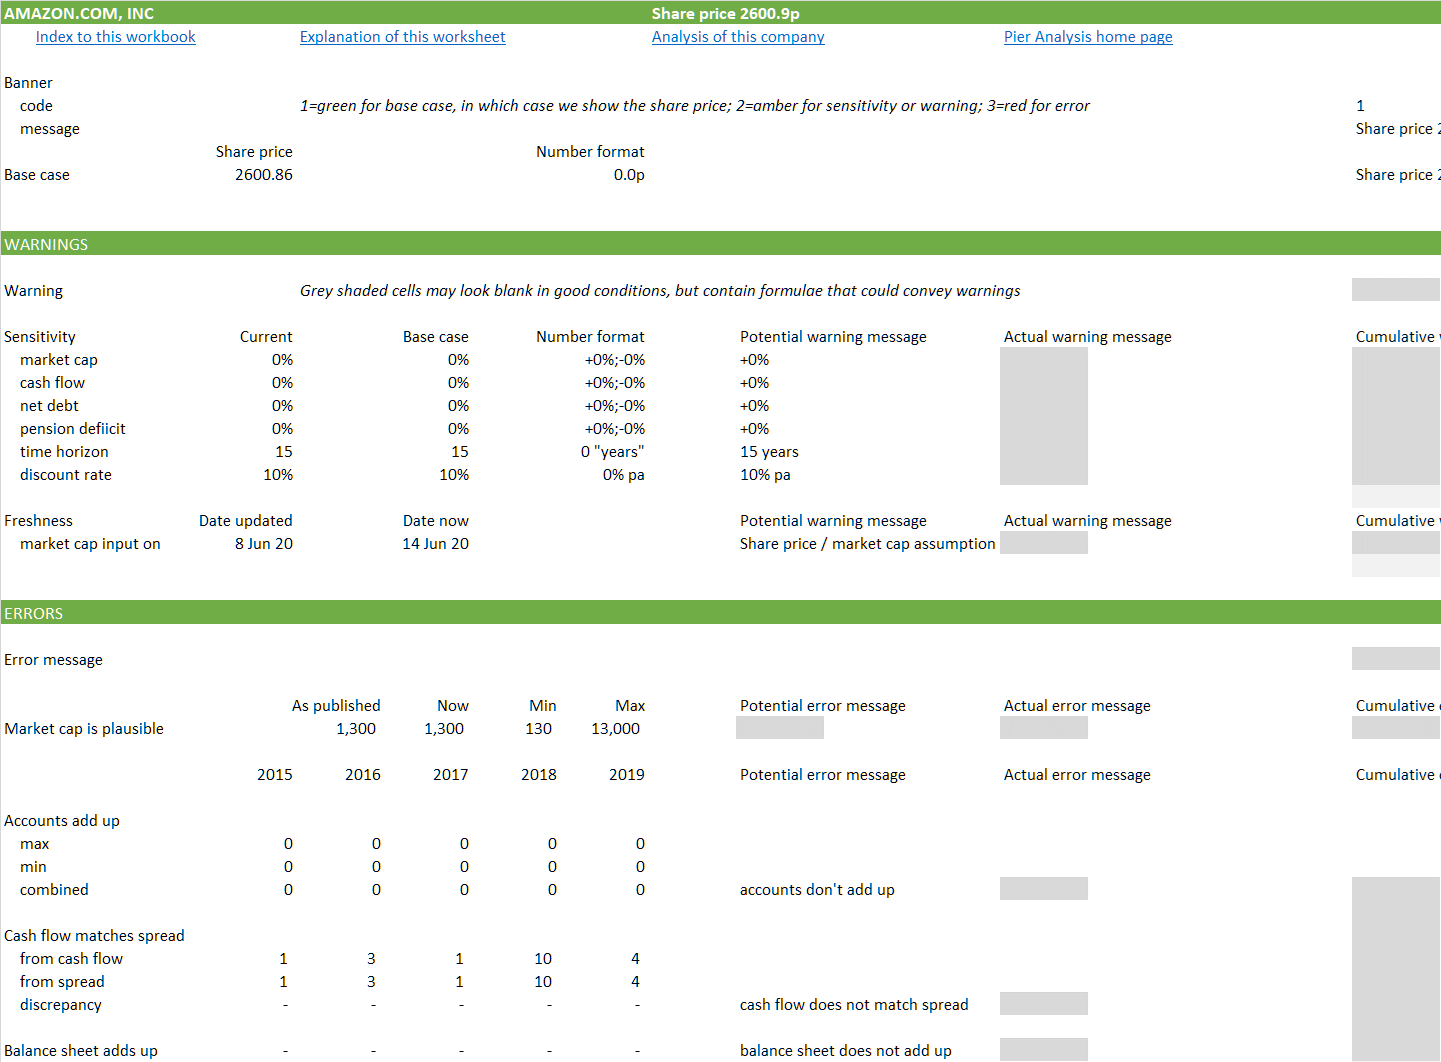
Pier Analysis seeks to minimise this hazard by devoting a considerable fraction of its models to checking themselves. That's the role of the worksheet called Audit.
Throughout the model there are rows which function like a traffic light.
If all is going well, they are green.
If the audit sheet detects errors, they turn red.
There is an intermediate state of amber, when the audit sheet determines a need to issue warnings.

Errors
The main risk that the audit sheet monitors is that the market capitalisation is implausible. Pier Analysis models are shipped with a recent value for the subject company's share price and market capitalisation. No mechanism is provided to update these values automatically. It's up to the user to do that by hand.
Take Amazon, whose market capitalisation is around $1.25t. That's one and a quarter trillion dollars. We could have set up the model to receive that assumption
in trillions, as 1.25
in billions, as 1250
in millions, as 1,250,000
in thousands, as 1,250,000,000
in dollars, as 1,250,000,000,000.
Which is it? Actually, it's the middle of these, the millions, because this input needs to be presented to the model in a form that is consistent with whatever was used in the annual accounts, and Amazon has chosen to express them in millions.
That fact is not obvious, because the number is displayed in billions, consistent with Pier Analysis's preference to show few significant figures, to make the presentation free of clutter and allow patterns to be seen easily. The number is typed as 1,250,000 but is displayed as 1,250. See here [link to come**] for a discussion of how this is achieved, and the advantages and disadvantages of doing so.
To guard against the danger that the user gets this wrong, the Pier Analysis model checks that any assumption for market capitalisation is somewhere between ten times smaller and ten times bigger than the one that prevailed when the model was shipped.
Other potential errors checked by the Audit worksheet include that
the balance sheets balances
the cash flow adds up
the direct cash flow consistently summarises the worksheet called Spread, where the headings from the indirect presentation of cash flow in the accounts are allocated to the direct one favoured by Pier Analysis.
Warnings
The main warning that the Audit sheet issues is that the market capitalisation is out of date. It does this by comparing today's date with the input that records when the market capitalisation assumption was entered. It is considered stale if more than 45 days have elapsed.
The Audit sheet also warns that a sensitivity is being run if
any of the sensitivity scalers are set at figures other than 100%
the rate of return has been set to a figure other than the 10% pa that Pier Analysis favours
the period over which the investment is evaluated has been set to a duration other than the 15 years that Pier Analysis favours.
What’s next
If you find this information interesting, you can sign up to have analysis based it delivered to your inbox several times a week.
Share Pier Review with interested friends.
Previous worksheet: Debt cover.


