


Netflix
Growth in Asia is more important than we had recognised
Pier Review wrote about Netflix on 23 September 2020. Since that time, the 2020 results have been published. How well does our analysis stand up to this new information?
Reversal of fortunes
In our September piece we wrote
The shares of [the currently fashionable technology businesses] are highly valued, to an extent that reminds some of the dot com bubble which burst in 2000. Others counter that current circumstances are not the same because the internet companies of 2000 had no profits, nor any business model, nor even any sense of how they might find one. Today's technology firms may be highly valued, these people say, or even overvalued, but they are fundamentally decent businesses, generating high revenues and heroic cash flows.
Except that in Netflix's case, it isn't. Alone among these firms, its cash flow is negative and becoming more so.
The reason the cash flow was negative was that it was spending prodigiously in the making of content for broadcast. It showed no intention of slowing down.
We have a substantial amount of indebtedness and other obligations, including streaming content obligations. Moreover, we expect to incur substantial additional indebtedness in the future and to incur other obligations, including additional streaming content obligations.
Since then Netflix has reported its 2020 results [1] and they show it generating positive cash flow for the first time.
Net cash generated by operating activities in Q4 was -$138 million vs. -$1.5 billion in the prior year period. Free cash flow (FCF) for the quarter was -$284 million vs. -$1.7 billion in Q4‘19, bringing full year 2020 free cash flow to +$1.9 billion vs. -$3.3 billion in 2019.
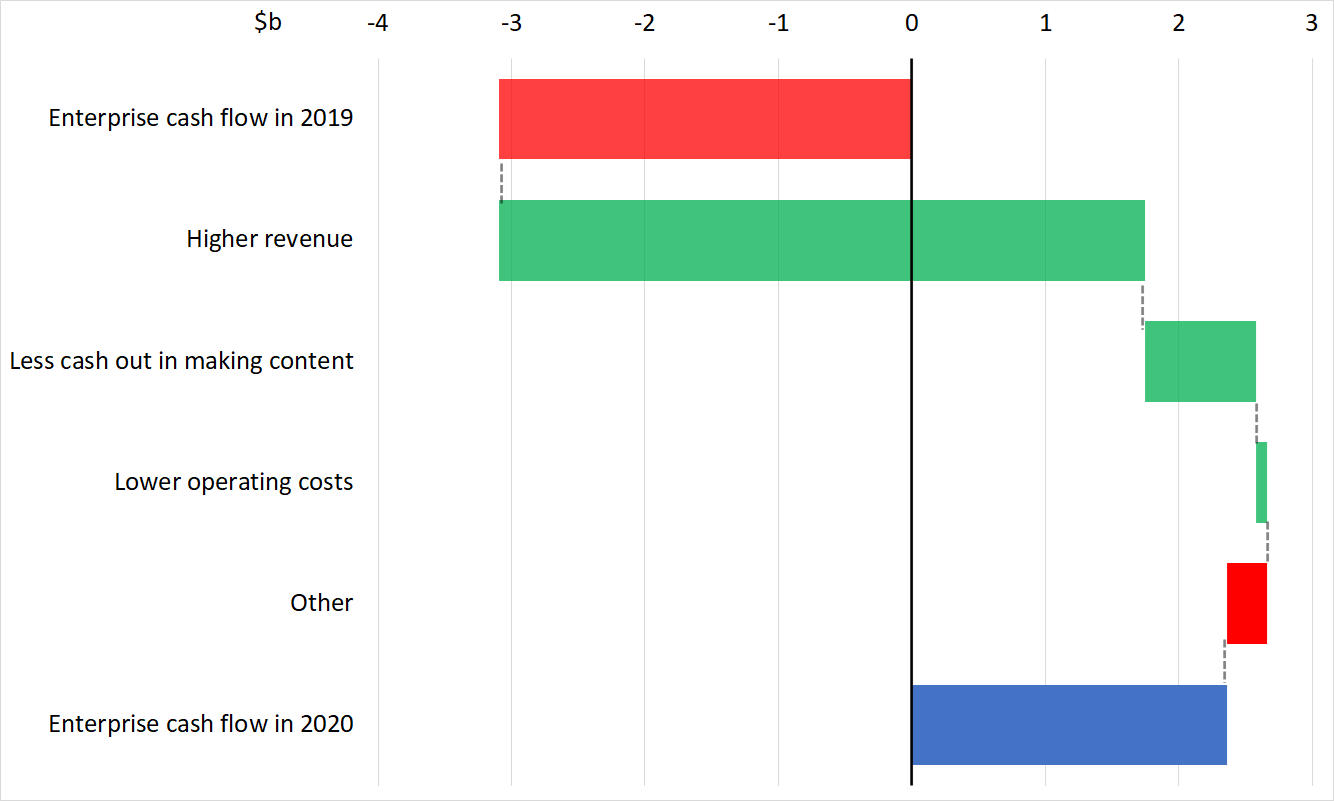
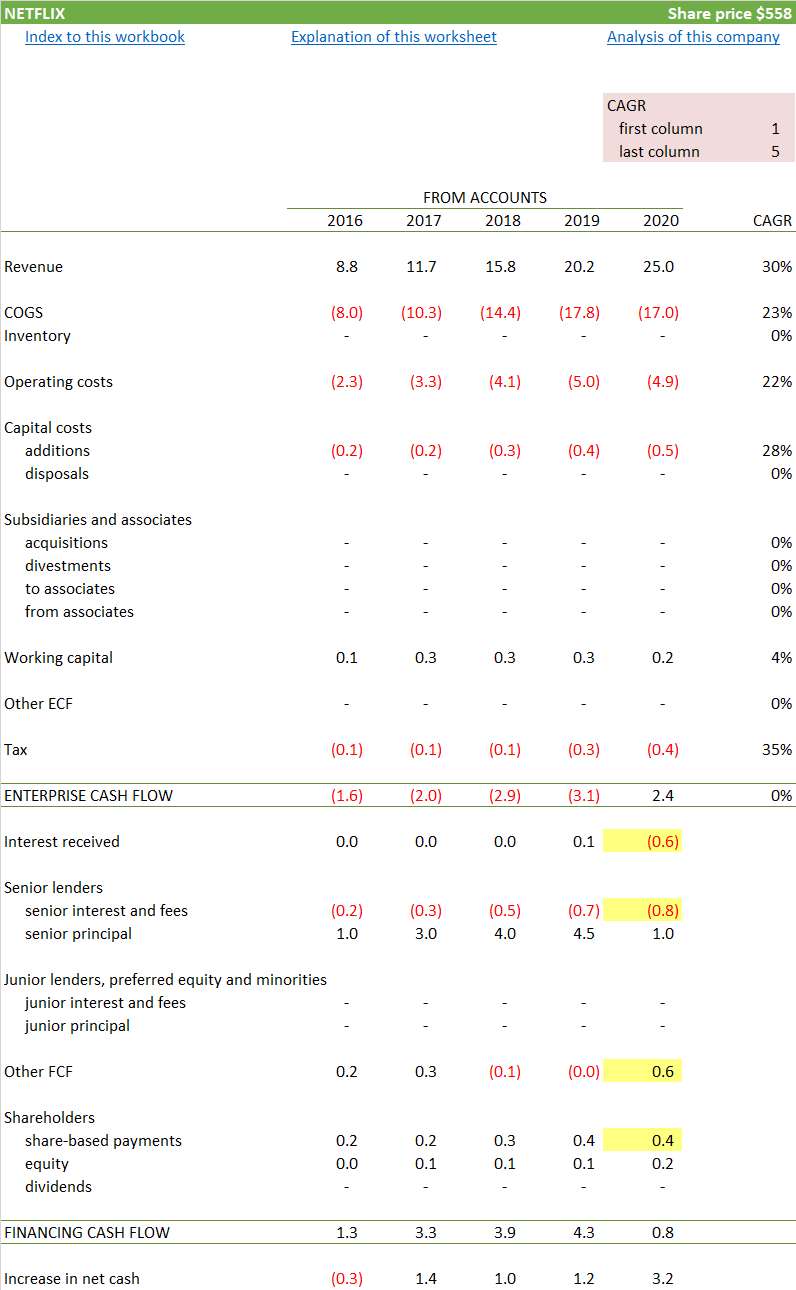
Company accounts almost always present cash flows in an indirect way which is not easy to follow. It is the habit of Pier Analysis to restate them in a direct layout, which intuitively starts with revenue and subtracts different kinds of costs until we arrive at what is available for lenders and shareholders. We call this quantity enterprise cash flow.

Highlighted in yellow: Our presentation shows the cash flow as even more positive than Netflix claims, at $2.4b rather than $1.9b [2]
Highlighted in red: Our article focussed on spending that seemed absurd in the context of near-term revenues, and argued for cutting it. Netflix has done no such thing.
Highlighted in green: The improvement in cash flow comes from revenue gains, not cost cutting.
We can confirm this by reconciling the 2020 cash flow to the one from the year before.
Now that we know that the improvement has come from strengthening revenues, we can look more closely to see where the new revenue is coming from. Netflix’s announcement of its results segments its business in terms of
UCAN (US and Canada),
EMEA (Europe Middle East and Africa)
APAC (Asia-Pacific region)
LATAM (Latin America).
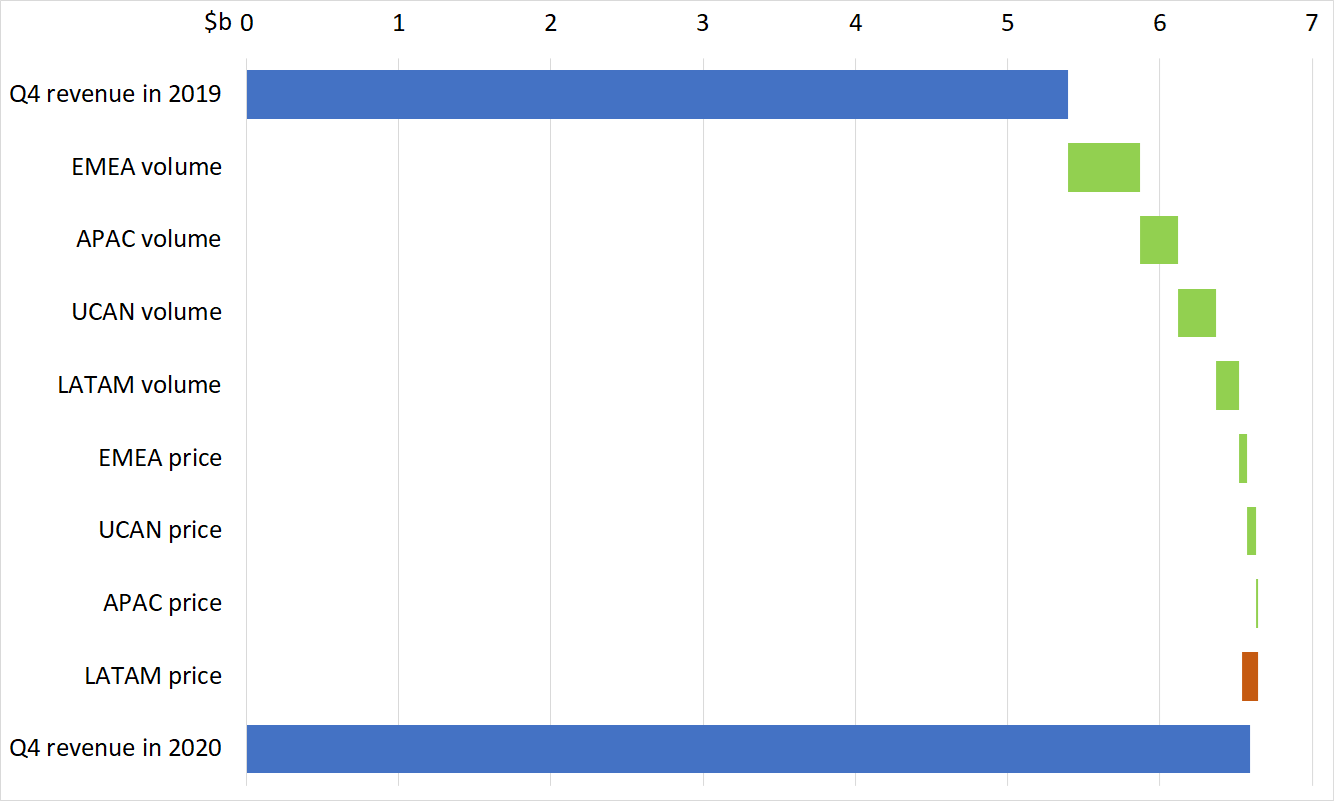
We can use this information to see how volumes and prices have evolved in the five quarters between December 2019 and December 2020
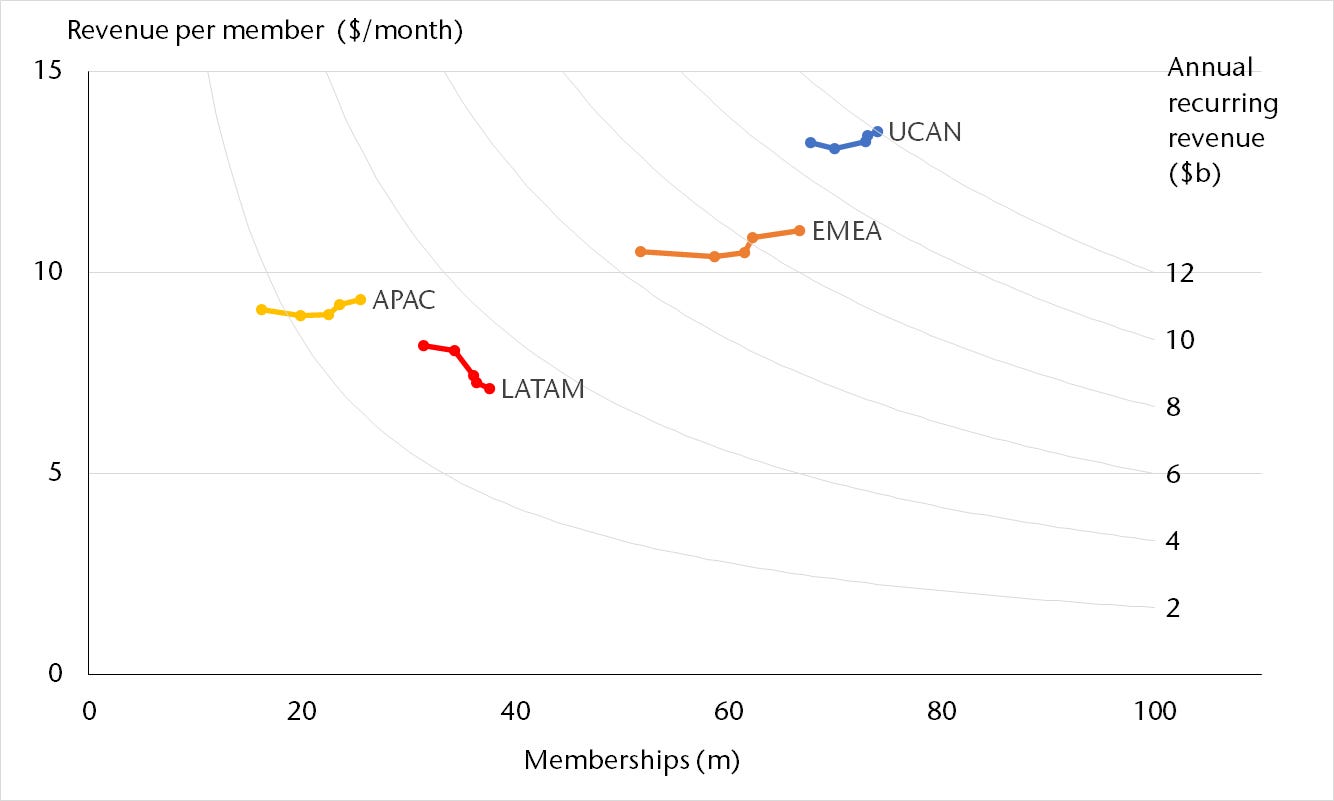
As we can see, most of the growth is in Europe. The fraction of Netflix’s revenue coming from outside the US has shifted from 49.5% to 45.3%. The Asia/Pacific region has grown by 63% in just a year. Overall, revenue has grown by 24%.
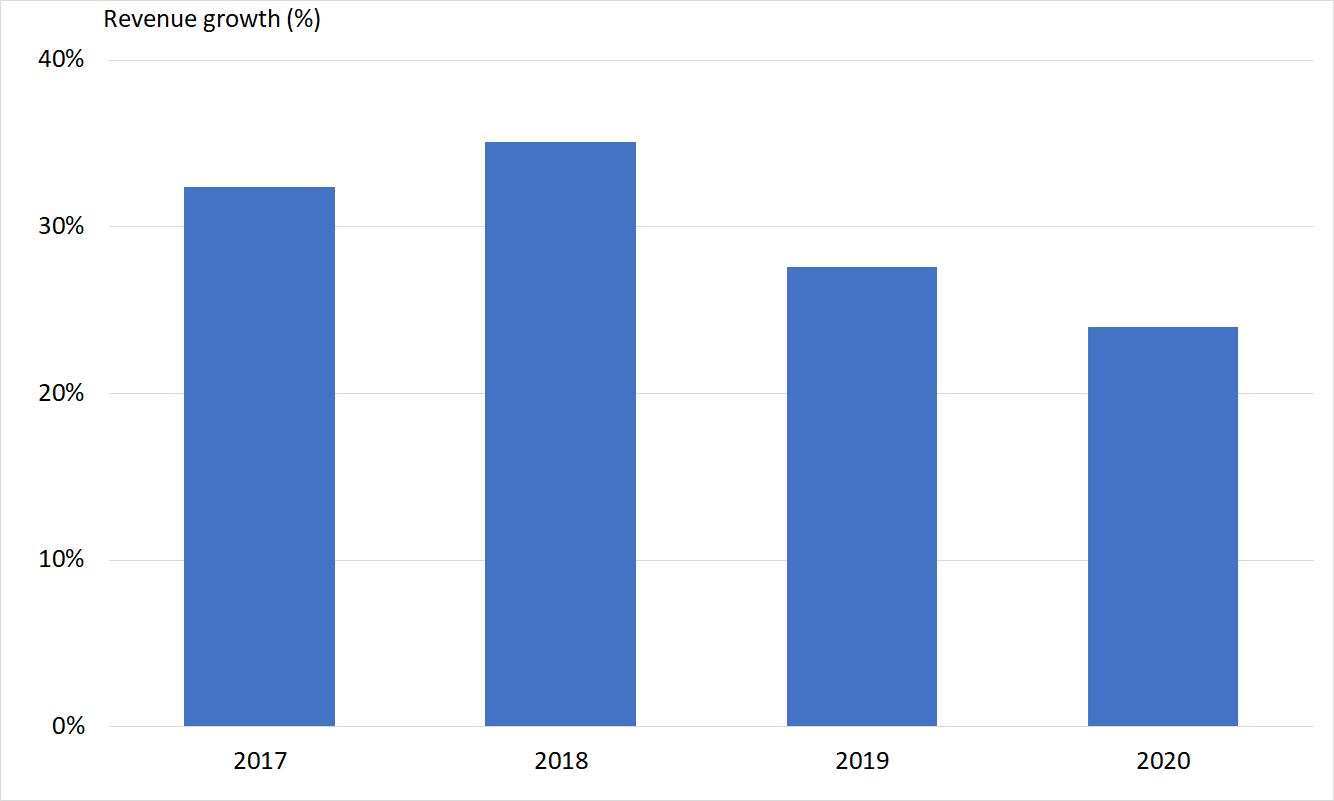
As the chart above shows, and the one below shows more clearly, that revenue growth is coming from growth in the number of members. Very little of it is coming from price increases. In Latin America, prices have fallen [3].
Which sounds spectacular, and one’s first thought is that it must be the result of the pandemic, leading people to sign up for Netflix to while away the time locked down. Netflix published this chart which clearly shows a Covid inspired bump in new memberships.
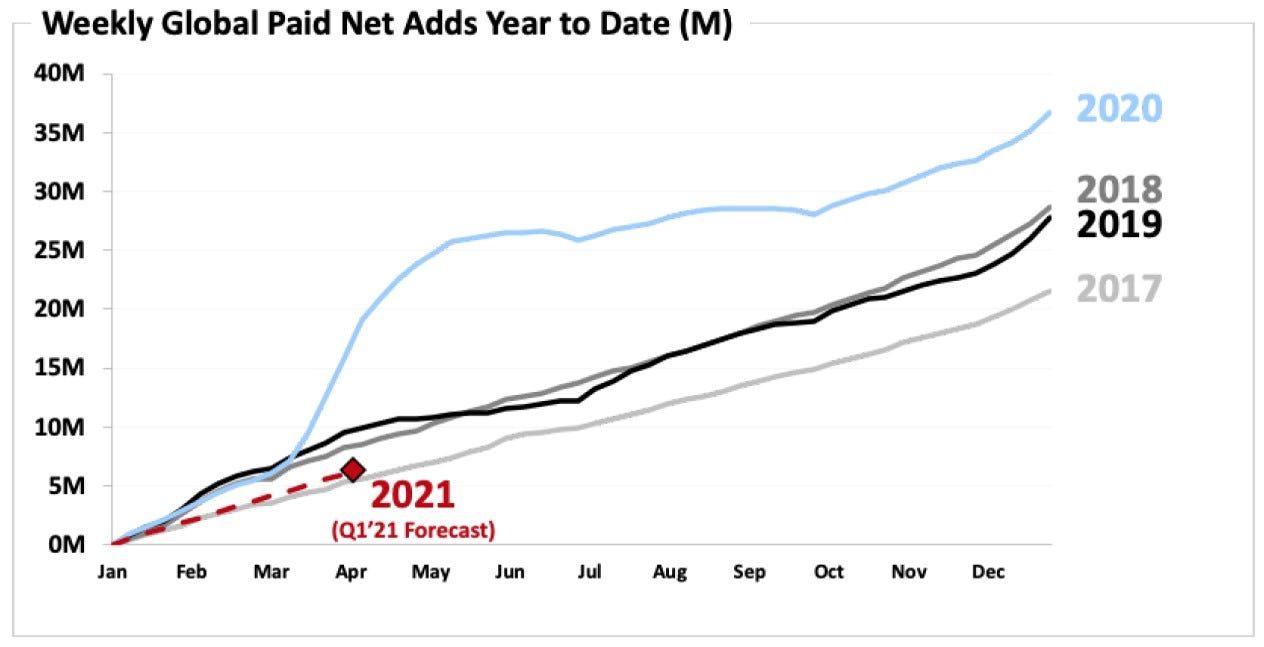
But although more people signed up during 2020 in numerical terms than in any past year, the rate of growth of memberships was not much larger than it was in past years when expressed in percentage terms. As the business gets bigger, it needs to attract an ever larger number of newcomers to maintain its historic growth rate. Outside the pandemic-driven second quarter of 2020, this isn't something Netflix is achieving. The dotted red line marked '2021 forecast' in the previous chart shows new memberships running below 2020, 2019 and 2018 in numerical terms, and that will be even more so in percentage terms. Netflix is decelerating, as is entirely to be expected. And growth in revenue is a little way behind growth in memberships, almost certainly because some of the new members are being recruited in regions where the membership fees have to be lower.
In North America revenue is growing no faster than 11% pa, and membership by only 9.3%. This serves as a guide as to what the other markets will look like as they mature, even if they are growing faster today.
None of that has stopped Neflix’s share price rising by 24% since September. Coincidentally, that's how much the revenue rose between 2019 and 2020, as if the market applied the existing sales to value multiple to the new level for revenues.
Enterprise value
What do we now need to believe about Netflix to justify its new, higher valuation?
To answer that, we start by working out Netflix’s enterprise value.
First, we go through the entries in Netflix's balance sheet line by line, to work out its net debt. We find it amounts to $8b.

To the amount the firm's lenders have at stake in the business, we add what its shareholders have at stake, that is, its market capitalisation. Today, that is $243b.
Take these things together, and we find an enterprise value of $251b.

Implied cash flow
Holding a stake in Netflix makes sense as long as we believe it can generate at least this much cash in the coming years. It doesn't have to do that immediately. It can take some time over it, but sooner or later we want our money back, or there is no point in us, or anyone we might sell our shares to in the future, putting our hard-earned savings into this business. Though others may be willing to wait for longer, Pier Analysis wants to be confident that Netflix can achieve this repayment within 15 years.
As well as generating the means for the gradual return of our capital, we want a return on it while we wait. We look for at least 10% pa to compensate us for the risks that we expose our hard-earned cash to when we invest it.
There are countless ways Netflix could satisfy these requirements, a selection of which are shown on the graph below.

Among the range of trajectories that would do the job is one in which cash flow starts around $31b and rises gently to $36b: this is the violet line.
Another way is to deliver a cash flow that is lower than this range in the early years, say $13b, but makes up for that by growing rapidly so that it is significantly higher in the later years, reaching $44b. This is the red line.
And there are infinitely many contours between these two examples, and beyond them. Any one of the cash flow profiles shown would put Netflix in the position to return our investment within 15 years and give us a 10% return while we wait for it.
Actual cash flow
We've already seen that Netflix's cash flow is in the region of $2b. For it to get to more like $45b is equivalent to hoping that it can treble its revenue, without adding at all to its costs; or quadrupling its revenue, while doubling it costs. Either option would make it larger than Disney; at the moment it is just a third of the size.
We'd better check that there are enough households in the world for this to be feasible. We've taken estimates of the number of households from Wikipedia. That's not the most scientific source, and some of the estimates are several years old, but it's good enough for our purposes. We’ve then allocate the countries to Netflix’s four regions, and performed the following crude analysis.
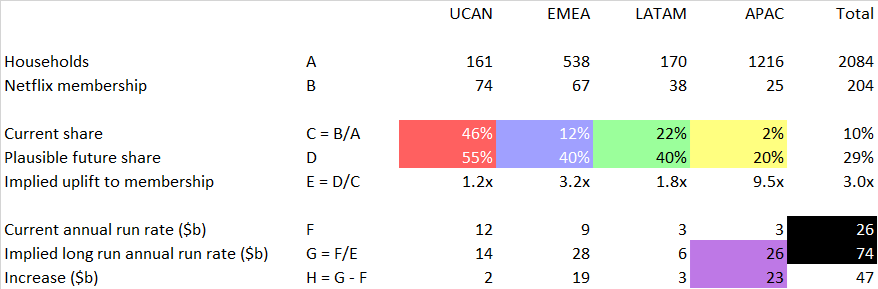
Highlighted in red: Netflix has already penetrated 46% of US markets. We assume that it can get up to 60%
Highlighted in blue: Because Europe has entrenched and subsidised national broadcasters, such as the BBC, which are popular at least with older audiences, we assume penetration in that region won't get past 40% of households. At the moment it's 12%.
Highlighted in green: We put Latin America at 35%; completely finger in the air. At the moment Netflix touches a surprisingly high 22% of households
Highlighted in yellow: Although the Asia Pacific region has half the world's households, well over half of those are in India and China which we assume to have their own entertainment industries, along with distinct cultures that won't automatically want an offering perceived to be American. Against this the rest of the region includes Japan, Australia and New Zealand which are likely to have stronger appetites for what Netflix provides. Netflix now reaches 2% of households; we assume it can get to 20%.
Highlighted in purple: This analysis leads us to the realisation that a large fraction of Netflix’s potential for international growth hinges on its ability to make headway in the Asia Pacific region.
Highlighted in black: There is no science whatever behind these wild guesses. They have been jiggled to show what would be necessary to treble Netflix's revenue.
The analysis is conservative in that it allows nothing for population growth, or for Netflix to raise its prices in real terms, as it did in the UK in recent days, or for those prices to rise with inflation. All of these offer upside beyond that shown here.
Many of the current technology valuations require us to believe that the relevant companies will do things that are implausible. That’s not obviously so for Netflix, though it is striking how much of the needed membership growth needs to come from the Far East.
The penetration levels doodled here are not unreasonable in the long term, but they need to come about very quickly if they are to satisfy Pier Analysis's requirement that companies deliver a 10% return over 15 years; too quickly to be realistic. If you will settle for a 5% annual return, and are willing to wait for it patiently for a period very much longer than our 15 years, then Netflix's current valuation doesn't require you to believe anything out of line with its recent accomplishments.
Self examination
Did we miss a trick last time? Yes and no.
We took at face value Netflix’s own expectation that it would remain cash negative for some time, and confess to being taken by surprise it is reaching positive cash flow in 2020. We shouldn’t have been; as we now see, all it had to do was increase its revenues by no more than it had managed in recent years and hold its costs roughly steady. If we had noticed this possibility, our article could have made a more interesting case: while the business had been bleeding cash, and said this would continue, it would in fact soon stop. It might have been reasonable to expect some share price movement on when news broke that cash break-even had been achieved, even if it would have been, in our cautious opinion, from a high valuation to a higher one.
In our defence, not only did Netflix's indicate in its 2019 accounts that continued investment and further funding would be needed; it is far from definitive even in its 2020 remarks that the cash flow corner has been decisively turned.
We believe we are very close to being sustainably FCF positive. For the full year 2021, we currently anticipate free cash flow will be around break even (vs. our prior expectation for -$1 billion to break even). Combined with our $8.2 billion cash balance and our $750m undrawn credit facility, we believe we no longer have a need to raise external financing for our day-to-day operations.
But the question at hand is not whether Netflix can at last get itself to earn more cash than it spends. Rather, it is whether Netflix can get its cash flows up to the point that its current valuation demands, if that valuation is to be justified. As we’ve seen, we have to believe some implausible things now, and what we had to believe in September was only a little easier to swallow.
In particular, we think that for Netflix to generate cash flows that justify its current valuations, it has to win a meaningful share of Asian markets. Could it do that? Perhaps; anything could happen. But one needs more certainty than that to bet the family fortune on this possibility.
Further reading
The always recommendable Stephen Clapham has written two articles (here and here) in which he tries to make sense of how Netflix amortises its investments in films and TV series. This isn't directly a concern for Pier Analysis, focused as it is on cash flows in which amortisation plays no part. Even so, Stephen's investigations touch on the depth of Netflix’s commitment to leaving current and potential investors well informed about the company's progress.
What next?
A distinctive feature of Pier Review is that it provides the financial model that underpins each analysis.
Many current valuations only make sense to those who are content with a return of less than 10%, and willing to wait more than 15 years for the return of their investment. If you are one of those, you can use the model to examine the effects of these less demanding requirements. To receive the spreadsheet
if you have not done so already, subscribe to Pier Review by using the box below
click here to pre-populate a message in your usual email program requesting that the spreadsheet be sent to you
switch to your email program and click Send to despatch the request.
If you find this analysis interesting, you can sign up to have others like it delivered to your inbox several times a month.
Share Pier Review with interested friends.
Notes
[1] The results have been announced in a press release. It includes financial statements but no notes or audit report. Figures are also laid out in a spreadsheet which exhibits a number of infelicities. The analysis in this article is therefore shallower than what will be possible when the full 10-K is published.
[2] Pier Analysis considers the cash flow to be even better than Netflix does. Netflix arrives at what it calls free cash flow after deducting a long list of costs that includes interest payments and exchange rate movements arising from its outstanding debt. In Pier Analysis’s mind these are firmly financing cash flows, and should not be subtracted to reach a measure of free cash flow. To be clear about the quantity is thinking about, Pier Analysis uses the term enterprise cash flow. The whole purpose of enterprise cash flow is to measure what is available for the providers of financing, and it should not have interest or other elements of financing already deducted from it.
Offsetting this, the cash costs of Netflix’s senior team is lower than it might otherwise be because Netflix pays them partially in stock options. Netflix treats the cash saving as a reduction in its operating costs. Pier Analysis disagrees. Shareholders did not get these individuals’ service at a discount. They paid for it in full, if not all in cash, then in dilution of their interest in the firm as a result of the shares newly being issued. Pier Analysis includes the whole cost of employing these individuals in enterprise cash flow, and recognises the cash flow benefit of paying in options rather than money as a species of financing cash flow.
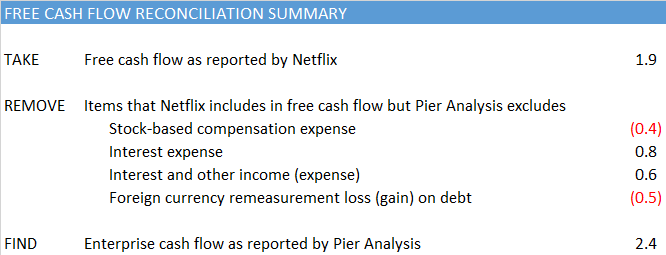
The items that Pier Analysis puts below the enterprise cash flow line, but Netflix puts above its free cash flow line, are highlighted in yellow.
[3] We don’t know why Latin American prices have softened. It is quite possible that they haven’t in local currency, and that the effect is the result of these countries’ exchange rates sagging during the pandemic.