


Apple
A company we thought expensive a year ago is now 40% more expensive
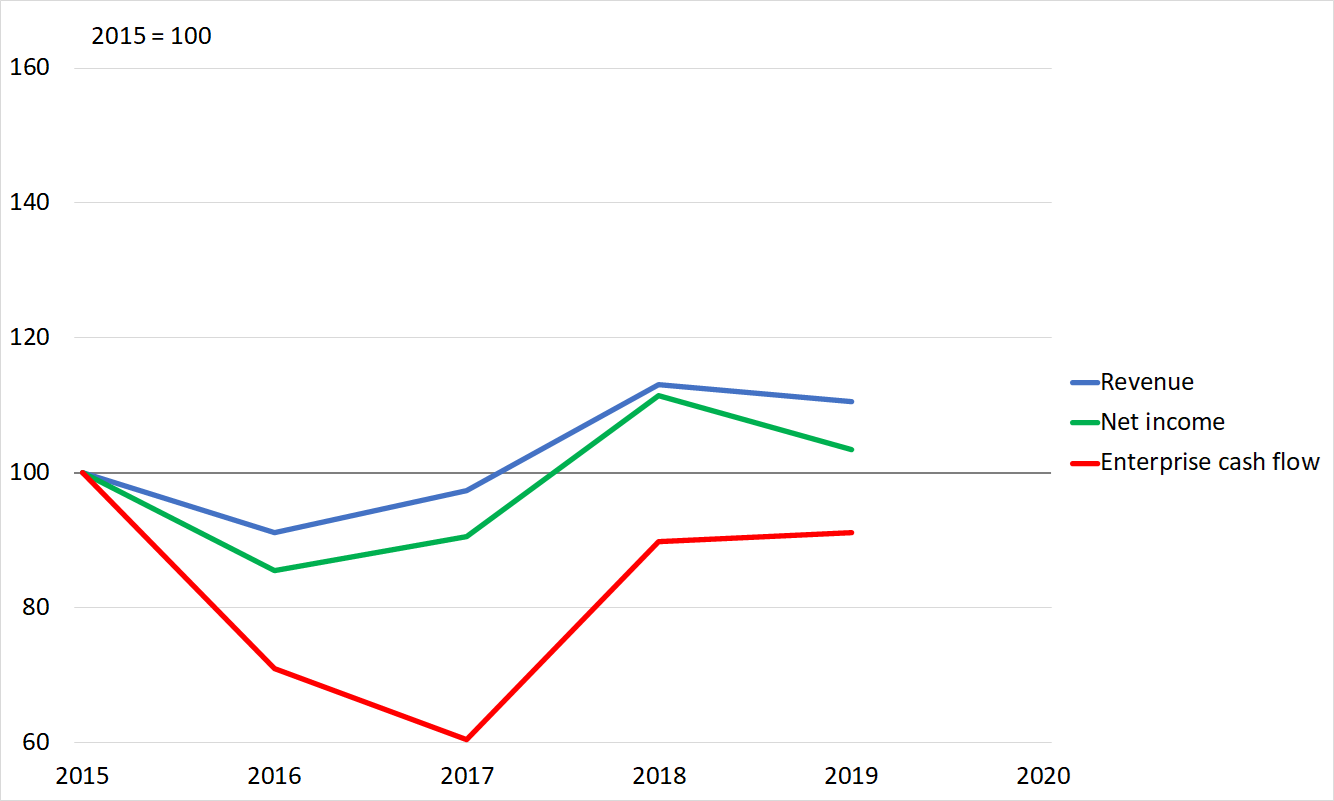
In the edition of Pier Review of 16 February 2020, we observed that Apple was priced like a growth stock, but it was not actually exhibiting any growth.
At no time between 2016 and 2019 did Apple’s enterprise cash flow venture beyond what it had been in 2015.
During that four year period revenue, net income and enterprise cash flow all fell in as many years as they rose.

Take Facebook as an example against which to contrast this performance. It quadrupled its revenue and more than quintupled its cash flow over the same period.
Growth resumes
In 2020, at last, Apple had a year in which it did achieve some growth

In fact, if we rebase our comparison to 2016, it can now be said to have a growing trend.

Anyone who ignored our analysis of a year ago will have done well. Apple’s market value was $1370b then; now it is $2,040b. The price of a single share has risen even faster, because the number of shares responsible for this market capitalisation has been driven down by share buybacks.
Rerating
The improved performance has no doubt contributed to the increase in valuation, but explains only part of it.
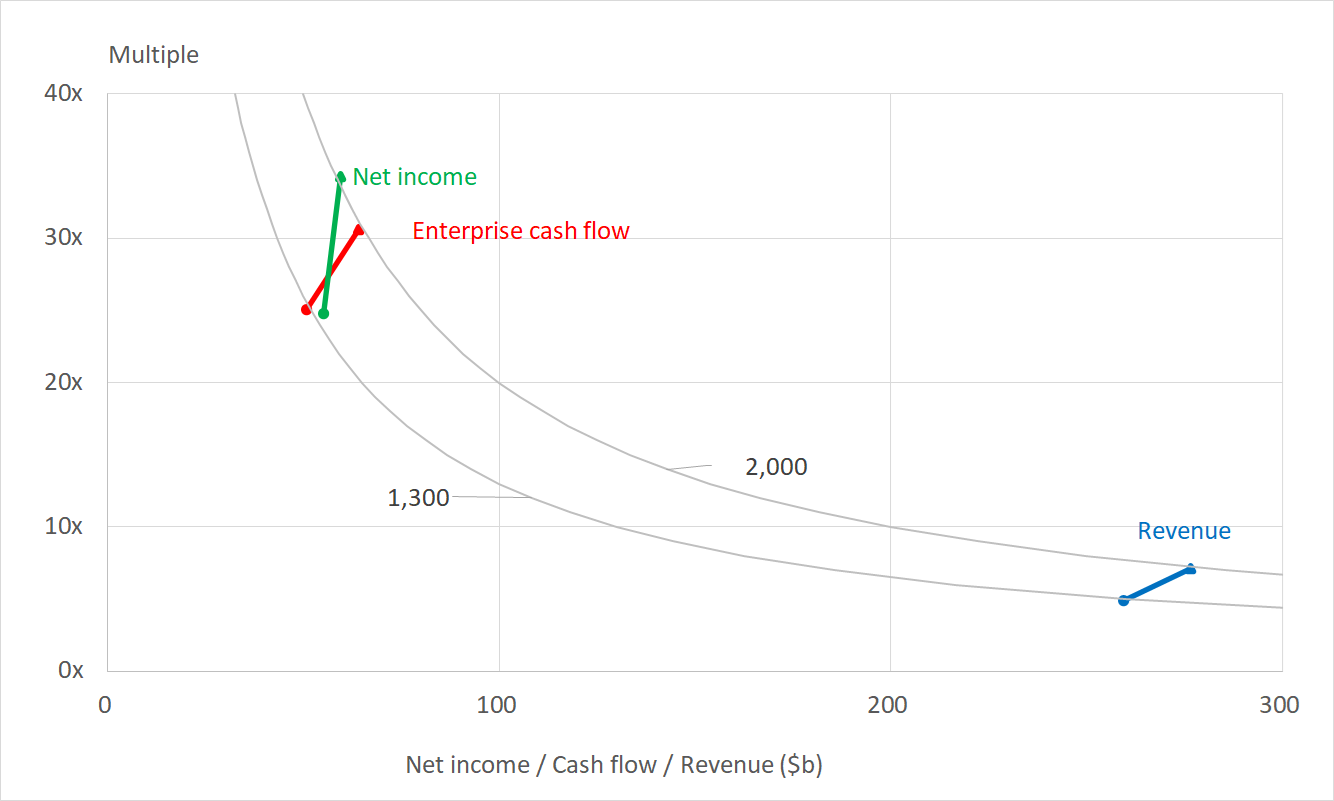
Much more, the increase in valuation is the result of the market attaching higher multiples to that performance.
The two contours represent the roughly $1300b valuation that prevailed in February 2019 and the $2000b valuation that applies now. [1]
Revenue rose 6.6%, but the multiple of sales implied by the valuations then and now moved from 4.9x to 7.1x
Enterprise cash flow increased just 26%, but the multiple of cash flow implied by the valuation shift moved from 25.0x to 30.5x.
Net income rose by 7.7% but the multiple of income (the P/E ratio) increased from 24.8x to 34.3x
These higher multiples are understandable now that the business has visibly broken out of a period of no growth. In addition, Apple chose to split its shares. Correctly allowed for as we have done in this analysis, a split should not make the slightest difference to valuation, but the lower share price may well have stimulated less sophisticated retail investors to renewed enthusiasm for the company.
What this means is that Apple, which we judged expensive 13 months ago, is now even more expensive. In a moment we will quantify that. Before we do, it’s interesting to reflect on those share buy backs. It makes sense for a company to buy back its own shares when its leadership believes the market to be undervaluing them. We judged Apple’s shares to be overvalued rather than undervalued, making a buy back a questionable thing to do. With the benefit of hindsight, now that we know that the shares are over 50% more valuable today than they were last year, the decision of Apple’s board to buy some of them back looks to be a better judgement than our own.
Enterprise value
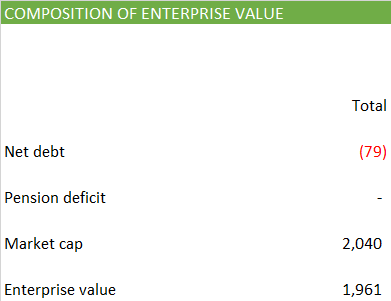
We’ve already seen that Apple’s market capitalisation has risen beyond $2,000b. That’s the most commonly used measure of the value of a company’s equity, the amount the shareholders have at stake in it. To find the value of the whole company, the enterprise value, we need to add the amount that it owes to its lenders. We can get that from Apple’s balance sheet.
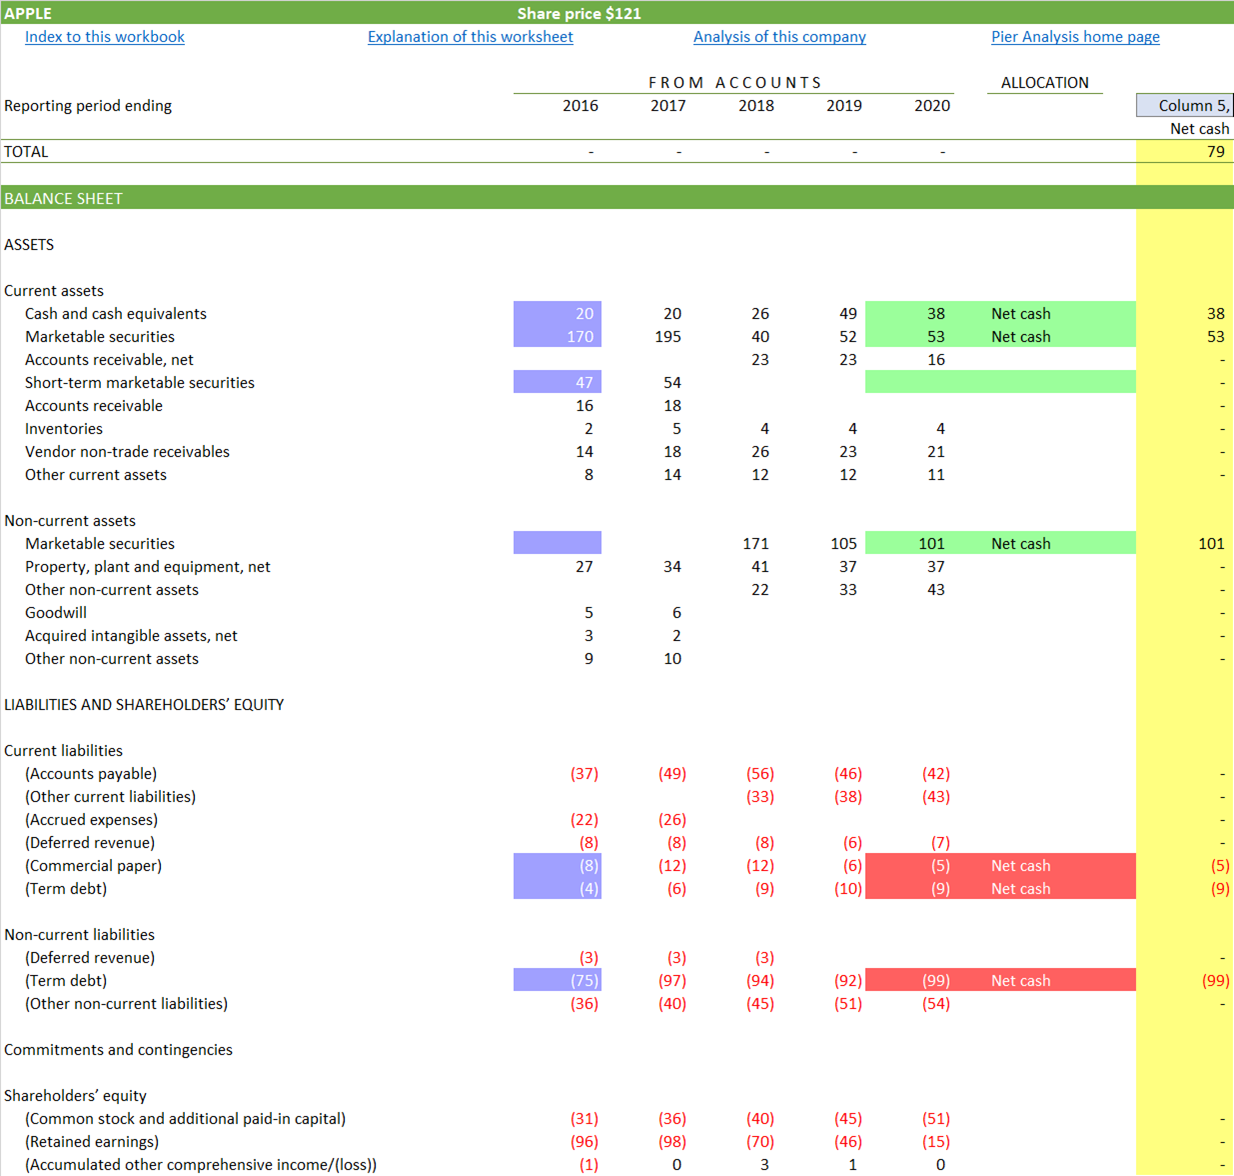
Highlighted in red: In 2020 Apple had $112b of debt and commercial paper outstanding.
Highlighted in green: Offsetting that is $192b of cash and investments.
Highlighted in yellow: The net position that results is negative net debt of $79b.
Highlighted in blue: In 2015 the comparable figure was $151b, so Apple has consumed over $72b of its famous reserves, on top of its prodigious cash flow, in the share buy backs just mentioned
Combined, this negative net debt and the market capitalisation give an enterprise value of $1,961b.
Required cash flow
Investors should place their money in Apple only if they expect it to be capable of generating cash flow sufficient to provide
eventually, over time, the return of their initial investment [2]
during the time that that takes, an additional return on the investment sufficient to compensate them for the risks they expose themselves to, and the other opportunities they forego, by tying their money up in the company.
How long should investors be willing to wait for this return of their investment? Standard practice in the investing community is equivalent to being willing to wait for ever. Those who support this approach base it on the notions that companies are constantly renewing their human, intellectual and physical capital and there is no obvious deadline by which their activities inevitably come to an end. Pier Analysis takes the crabbier view that companies are not immortal, and wants its money back over fifteen years.
Regular readers will by now be familiar with this short time horizon and our reasons for favouring it. We admit to some sheepishness in applying it to Apple. It seems inconceivable that a company so dominant could have evaporated by 2036. Even if the company stopped making hardware tomorrow, the market for parts, software and services to support the hundreds of millions of iPhones, iPads and computers in use today would continue for a long time.
But we persist with our fifteen year horizon, mainly for consistency and ease of comparison with our analyses of other companies. We also point out that
Until recently over two thirds of Apple’s revenue has come from the iPhone, making it a much less diversified business than is commonly understood. [3]
Firms once dominant in the phone business include Nokia and Blackberry. Neither is quite so prominent anymore.
Apple has been fair value under our criteria at various points in the last decade; anyone who bought it then, as we and several readers did, has done very well.
The whole point of these demanding criteria is to sift for companies experiencing attractively valued moments, and to leave an ample margin of safety
In our last article we introduced a new exhibit, which we apply to Apple at the end of this article, to show how the opportunity looks to investors with a longer-term outlook than Pier Analysis.
As for the rate of return that investors should hold out for, we continue to look for 10% pa, as we do with all our analyses. Again, the new exhibit at the end will show what Apple looks like to those who are content to accept a lower figure.
Given all of this, for Pier Analysis to consider that the current enterprise value is justified, it would need to find plausible the idea that Apple can deliver cash flows, over the next fifteen years, which have a net present value of $1,961b when discounted at 10%. One way Apple could manage this is to deliver cash flow of around $244b to $283b. This is the violet line on the chart below.
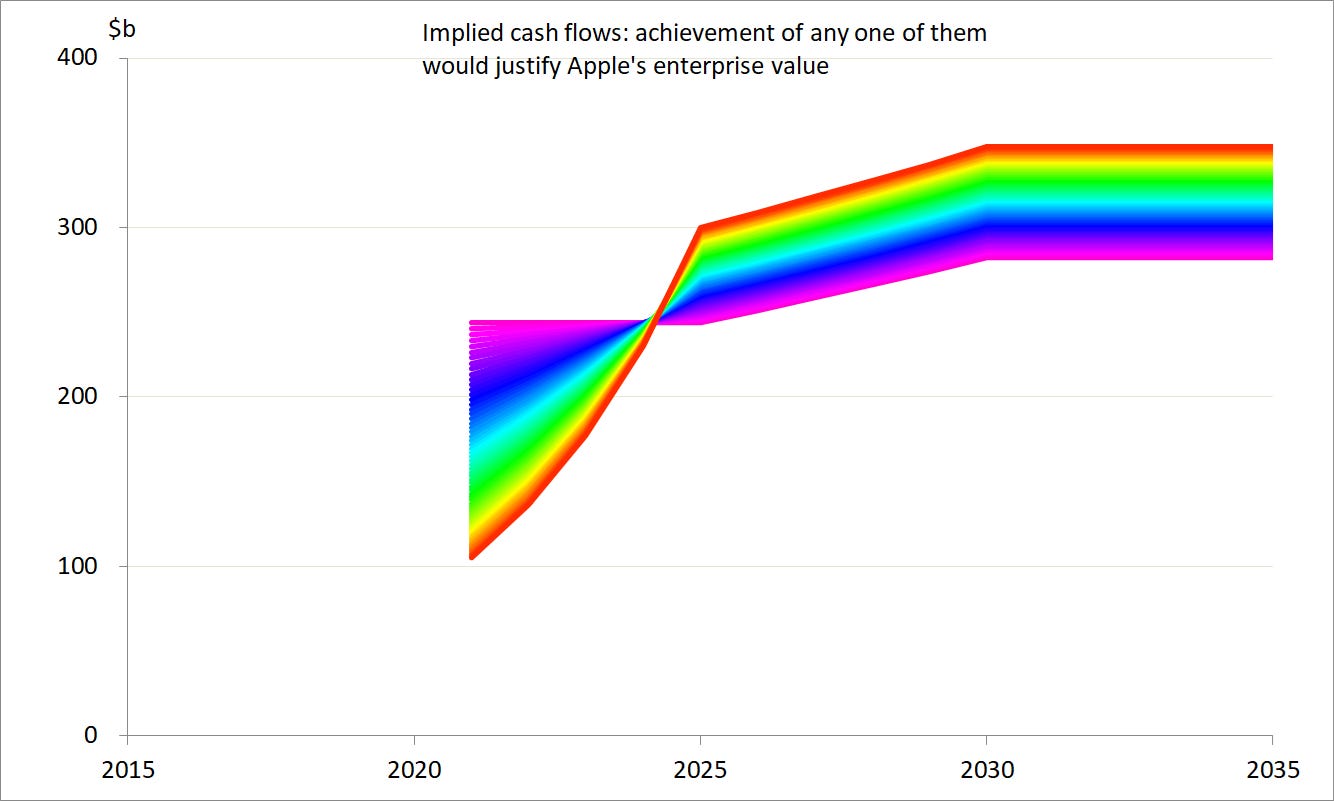
Another way to accomplish it is to provide a cash flow that starts much lower, at around $105b, but compensates for that fact by finishing much higher, at around $348b as a result of growing very much faster. This is the red line on the chart. We concentrate the growth, which needs to be at quite a clip, in the next coming five years.
The other colours show hundreds of equally valid permutations between these extremes. There exist infinitely many more beyond those that are not drawn on the chart.
Actual cash flow
Now that we know roughly what cash flow Apple needs to deliver to justify its lofty valuation, we can take a look to see what it has actually managed in recent years. On the left is what the accounts show, after we have restated the cash flows from the accounting profession’s impenetrable indirect format into an easy to understand direct layout.
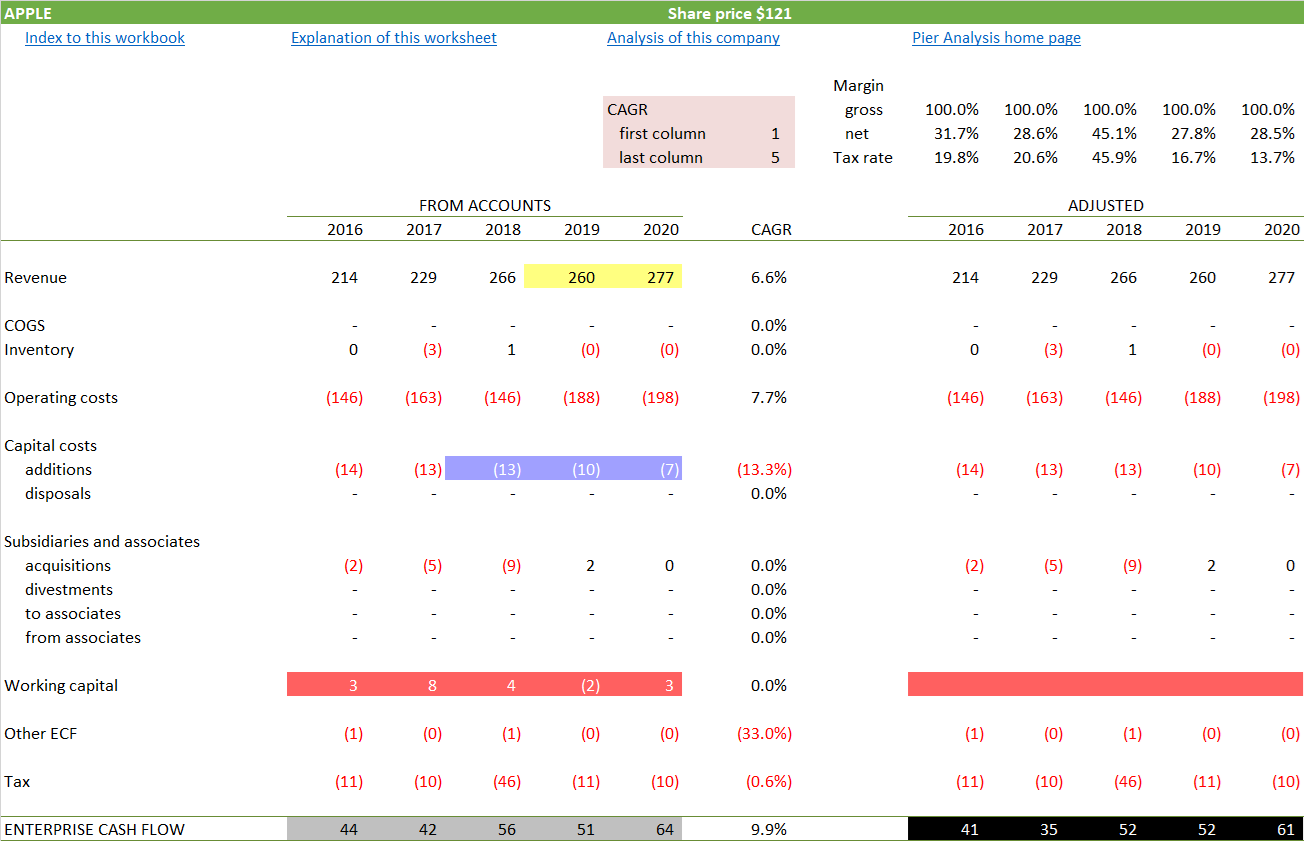
Highlighted in yellow: As already shown, Apple’s revenue grew nicely in 2020.
Highlighted in blue: We remarked on Apple’s capital spending last time we covered the company. It is smaller than that of other tech stocks, and shrinking at a time when theirs is growing. The decline continued in 2020. The explanation appears to be that Apple pursues a more conservative accounting policy than its peers, categorising research and development as an operating cost and so writing it off in the year it is incurred. Others include it among capital costs, to be recognised over a longer period. What Apple shows as capital costs are confined to land and buildings, leasehold improvements, machinery, equipment and internal use software. Elsewhere in the annual report Apple shows itself to be spending $18.7b on R&D, amounting to 7% of sales and rising around 14-16% pa. Even that is small compared with competitors. Some might argue that it is a sign of the benefits of Apple’s scale; it can pursue a competent R&D programme without needing to spend twice as much as a competitor half its size.
Highlighted in grey: We find Apple’s enterprise cash flow reached $64b in 2020, up 26% from the year before.
Highlighted in red: In the search for a measure of Apple’s underlying cash generation capability, we show on the right a version of the cash flow which is adjusted to eliminate items that cannot be relied on to recur. Here we removed the slightly positive cash flow contributed by working capital.
Highlighted in black: The adjusted version of the enterprise cash flow is $61b.
Plausibility
We can now represent these grey- and black-highlighted cash flows as grey and black lines alongside the rainbow-coloured required future cash flows already shown.

It’s clear that there is no plausible extrapolation of the historic cash flows that gets us close to the future ones required to justify an investment in Apple at its current valuation.
Financing
It is interesting to see what Apple is doing with this enterprise cash flow.

Highlighted in yellow: Only a modest part of the return to shareholders takes the form of dividends. The dividend yield is 0.7% pa.
Highlighted in green: Much more of the return to shareholders takes the form of share buybacks. If the dividends and buybacks are taken together, Apple can be said to be delivering 4.2% pa to shareholders.
Highlighted in blue: In recent years Apple’s cash flow was not enough on its own to pay for the buybacks. It covered the difference by liquidating investments, here shown as “Other financing cash flow”.
Highlighted in red: Before that, Apple covered the buybacks by borrowing.
Highlighted in purple: In 2020, few investments were realised, and the buy back was paid for mainly out of cash flow, and to a much smaller extent out of cash reserves.
Business mix
Given that Apple has started growing again, it is interesting to see where the growth is coming from.
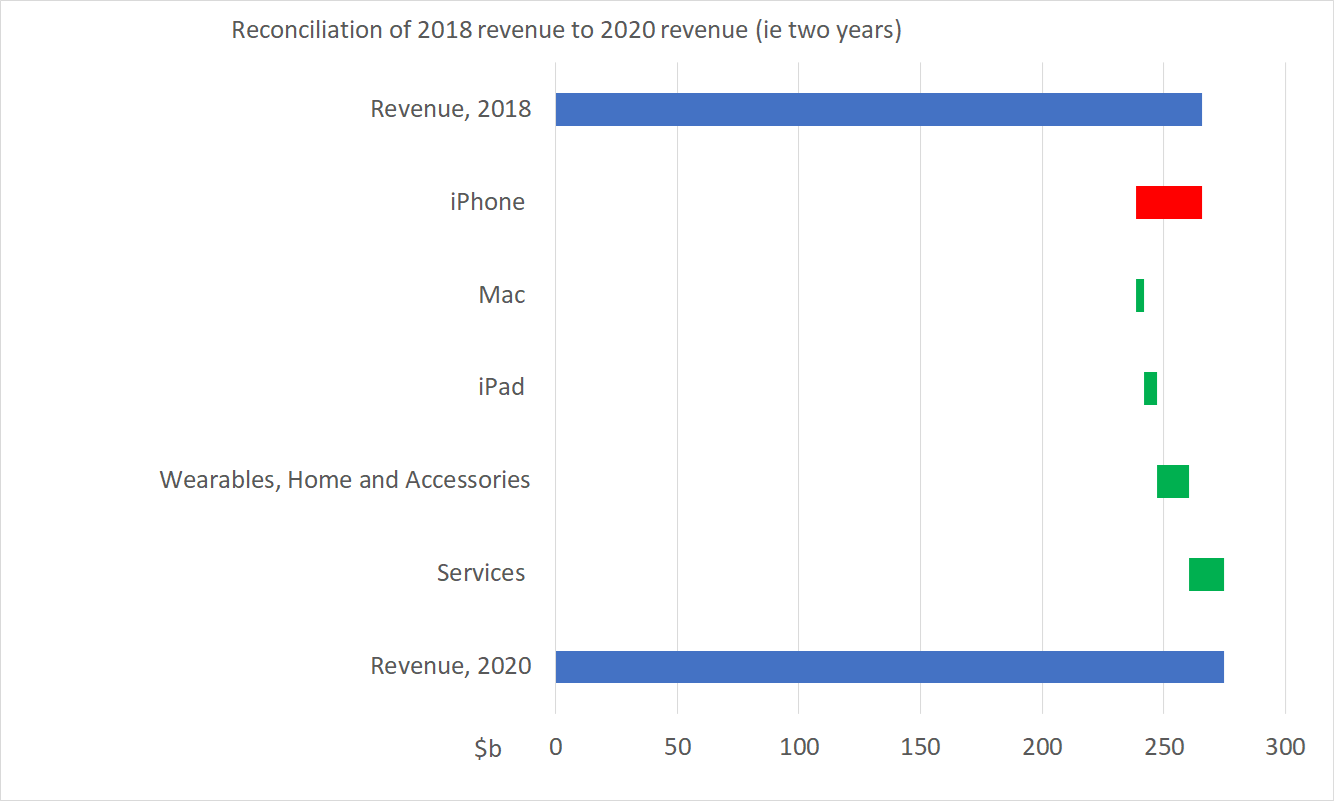
From the 2020 10K
iPhone
iPhone net sales decreased during 2020 compared to 2019 due primarily to the absence of new iPhone models in the fourth quarter of 2020 and the weakness in foreign currencies relative to the U.S. dollar, partially offset by the introduction of iPhone SE in the third quarter of 2020.
Mac
Mac net sales increased during 2020 compared to 2019 due primarily to higher net sales of MacBook Pro.
iPad
iPad net sales increased during 2020 compared to 2019 due primarily to higher net sales of 10-inch versions of iPad, iPad Air and iPad Pro.
Wearables, Home and Accessories
Wearables, Home and Accessories net sales increased during 2020 compared to 2019 due primarily to higher net sales of AirPods and Apple Watch.
Services
Services net sales increased during 2020 compared to 2019 due primarily to higher net sales from the App Store, advertising and cloud services.
If this trend continues, the iPhone will account for less than half of Apple’s sales in 2021. It will be good to be less reliant on a single product line, and recognition of this change may well be contributing to the re-rating.

Other outlooks
Pier Analysis’s attribution of zero value to cash flows beyond year 15 is out of line with the market, intentionally so. This chart, introduced in our last newsletter and now applied for the first time to Apple, shows what Apple looks like to a range of investors.
We’ve already established that Apple’s enterprise value is $1,961b and its adjusted cash flow is $61b. From these facts alone, we can see how the rate of return evolves over time, at various rates of growth for the enterprise cash flow. [4]
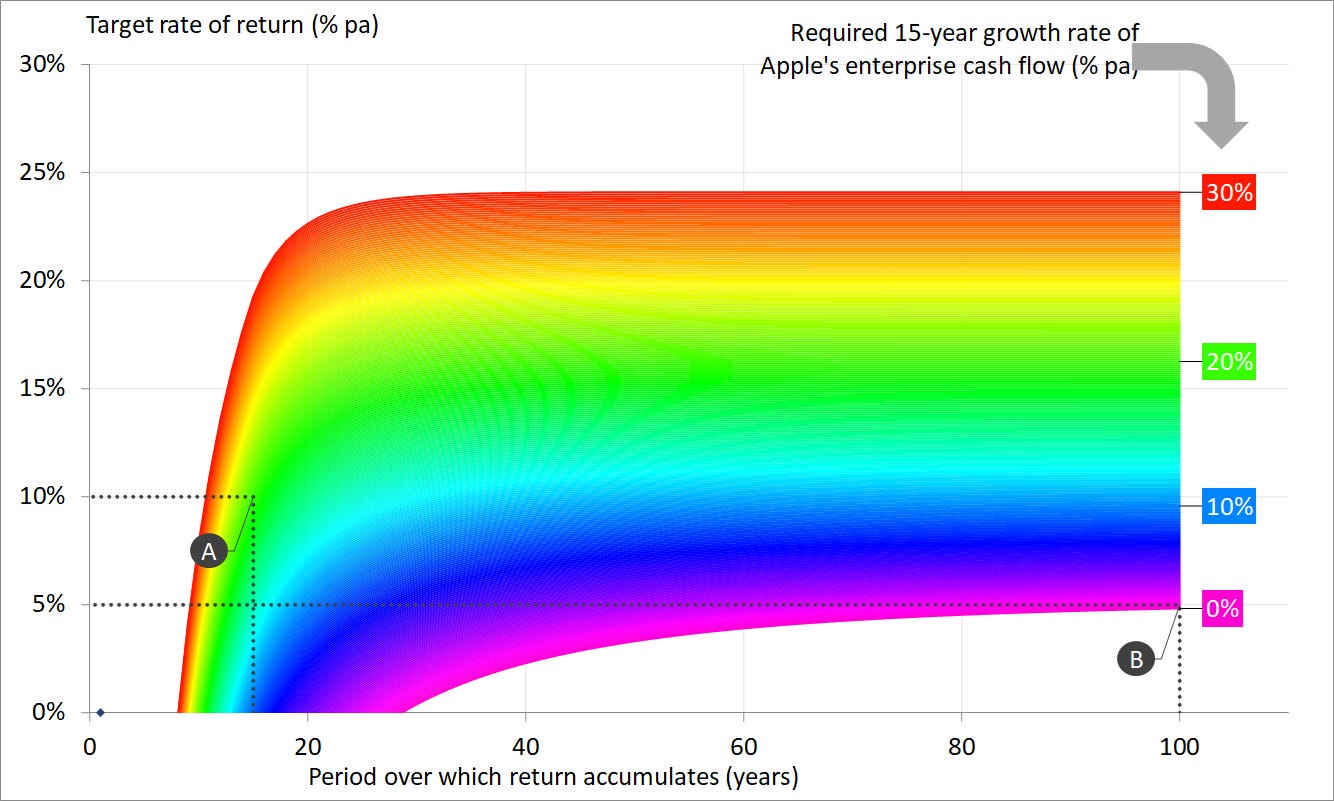
The bottom of the violet line shows that if Apples’ cash flow stays at its 2020 levels, not growing at all [4], an investment made in it now won’t break even for 28 years. If the holding is kept for a very long time, the rate of return converges to around 4.8% pa.
The red line shows that if Apple managed to grow its cash flow at 30% pa [4], an investment now would break even after 8 years and eventually converge towards a return of 24% pa.
Point A shows how the opportunity looks to Pier Analysis. It seeks a 10% pa return over 15 years. Those lines intersect on the green area of the graph, which, the labels to the right indicate, corresponds to a growth rate of 20%. This means that Pier Analysis would have to believe Apple can grow its cash flow at around 20% pa or so if it is to consider the current valuation to be an attractive one. [4, 5]
Point B shows how things look to more conventionally minded investors. We assume they seek a 5% return and are willing to stay invested for as long as it takes to get it. Alternatively, they believe that there exist other investors with that mindset who will buy their shares whenever they felt the need to sell them. Those lines intersect at the violet end of the graph, which corresponds to a growth rate of no more than 0.5% [4].
To these investors, Apple if anything seems underpriced.. As has been the theme of this article, its cash flow is growing again, certainly faster than 0.5% pa. It doesn’t seem demanding to hope it can keep that up for a few years.
However, recall that for the five years up to last year Apple had not been growing at even that modest rate. It was shrinking. Who knows whether that might come about again? And recall that point B on the chart requires Apple to maintain its present size in real terms for decades ahead. Might it manage that? Of course it might. Several of the large oil companies are about a hundred years old. But would you bet the family fortune on the possibility that Apple, or any other company, will last that long? Technologies will evolve in ways yet to be imagined, and the world will be exposed to risks that are no more anticipated than was Covid before late 2019. Returns will fall well short of investors’ assumed 5% pa expectation if Apple encounters any trip hazards that upend it before it celebrates its centenary.
Verdict
Apple’s valuation remains too rich for us, as there are other opportunities which demand less faith in a benign world over a long period. But don’t listen to us: doing so does you out of the 50% rise that current markets have bestowed on Apple since we last reviewed it.
What next?
A distinctive feature of Pier Review is that it provides the financial model that underpins each analysis. The model reproduces the key financial statements from the last five years’ accounts and shows how the numbers in this article are derived from them.
To receive the spreadsheet
if you have not done so already, subscribe to Pier Review by using the box below
click here to pre-populate a message in your usual email program requesting that the spreadsheet be sent to you
switch to your email program and click Send to despatch the request.
If you find this analysis interesting, you can sign up to have others like it delivered to your inbox several times a month.
Share Pier Review with interested friends.
Notes
[1] Correctly and carefully, revenue and cash flow are here compared with enterprise value, and net income is compared with market capitalisation. This is why the red enterprise cash flow dot touches the $1300b contour, but the green net income line is a little above it. In Apple’s case, it makes almost no difference, as the capitalisation dwarfs the (negative) net debt, leaving the two measures of value almost indistinguishable.
[2] Even those who intend to sell the shares rely on the existence of others who believe that the company is good for repayment of whatever they put into it.
[3] Other technology stocks are concentrated too. Alphabet makes nearly all its money from the Google search engine, and not a lot from its myriad other activities. Some say that Facebook makes all of its money from Instagram. For Amazon, its Web Services are critical.
[4] No company can grow at high rates forever, for which reason we confine the growth assumption to the first fifteen years. After that we take a rate of 3% pa, intended to serve as a proxy for inflation and/or GDP growth.
[5] The chart with a rainbow of colours in the middle of this article shows what cash flows Apple needs to generate to deliver a return of 10% pa over just 15 years. In that analysis the growth is concentrated in the first five years. Point A on the final chart also seeks a return of 10% pa over 15 years, but here the growth is even over the fifteen year period.