


Chart: Past and implied cash flow
The question on which Pier Analysis focuses
This note is part of the Pier Review reference material.
Previous worksheet: Value for money analysis Next sheet: Growth rate.
Colourful futures
The sheet Past and implied cash flow carries the graph that characterises Pier Analysis’s approach.
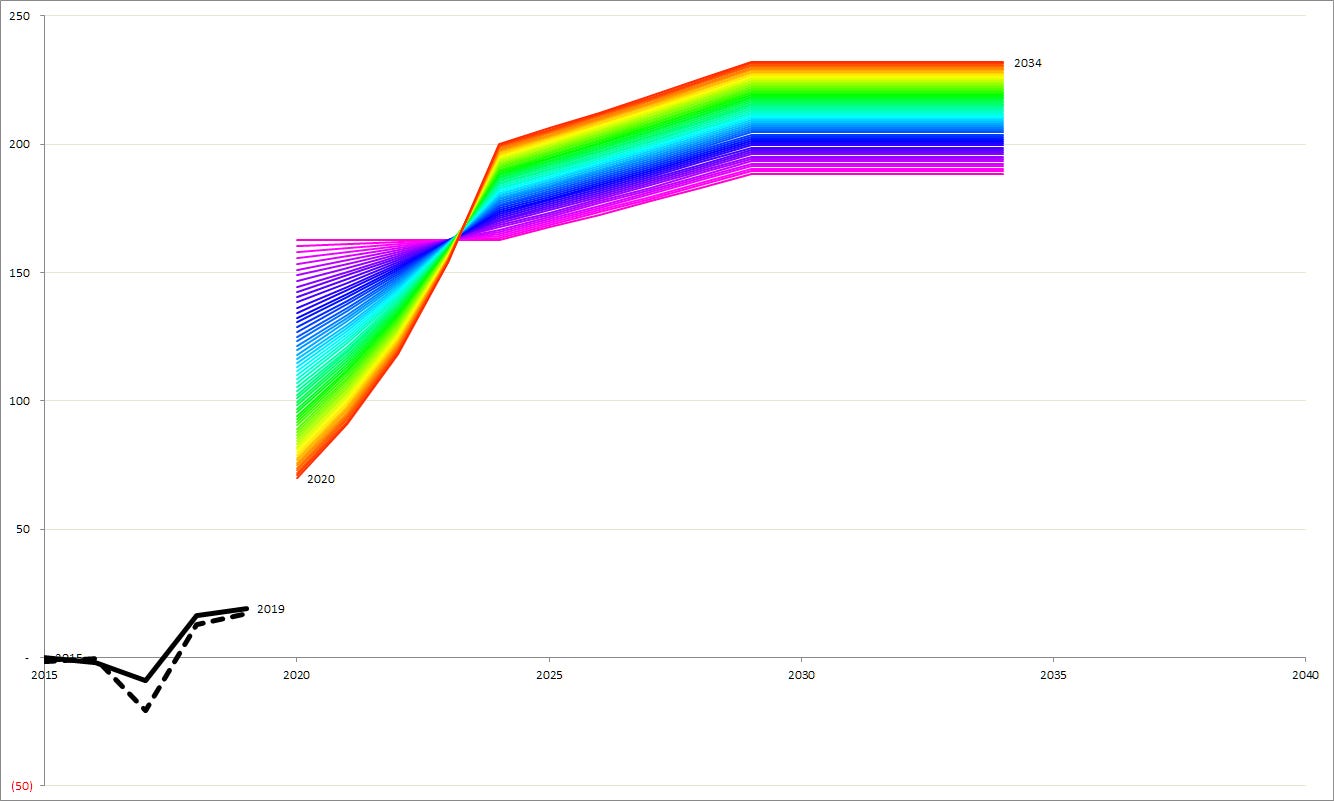
The coloured lines show showing various possible trajectories for the company’s future cash flow generation, each of which would justify the current valuation. By this we mean that, when discounted at our favoured required rate of return, they deliver a net present value equivalent to the company’s enterprise value.
The violet lines are fairly constant through time. The red ones grow quickly, which allows them to start lower, but finish higher than the violet lines, and still deliver the same NPV. Some, and maybe all of these paths may be highly implausible.
History in black and white
The black lines show how much cash the company generated in the recent past. The dotted one shows what is implied by the accounts. The black one shows a version of those numbers after they have been adjusted to strip out items that are unlikely to recur. If there are no such adjustments, the dotted line will be invisible because the black one will be on top of it.
The key question
The question Pier Analysis wants you to answer is: are any of the coloured lines plausible extrapolations of the black one?
A company in which the coloured lines are significantly higher than the black ones is one whose valuation has more optimism than realism. In today’s inflated markets, this is the majority of companies.
A company in which the black lines are quite a bit higher than the coloured ones is one that the markets are expecting to shrink.
No judgement
Most equity analysts try to make forecasts of a company’s future that are plausible. That takes lots of fine judgement. Some analysts are better at it than others.
The forecasts here, shown in the coloured lines, make no effort to be plausible. As a result, they demand no judgement. They are simple and inevitable mathematical consequences of the required rate of return and the number of years we let the cash flows continue for.
Where the judgement lies is in the answer to the question above. Given what it has managed in recent years, does the company have any chance of hitting any of these possible futures? By design**, in the majority of cases the answer will be no.
Previous worksheet: Value for money analysis Next sheet: Growth rate.
What next?
If you find this information interesting, you can sign up to have analysis based it delivered to your inbox several times a week.
Share Pier Review with interested friends.